Confirming Peak Integration
Where do you start checking when reproducibility is poor for peak areas or quantitation values? Should you suspect a pump delivery malfunction or autoinjector injection malfunction and start inspecting the equipment?
No, just wait a minute. First, investigate whether chromatogram peaks are being integrated properly and the baseline correction line is appropriate. A slight difference in peak integration parameters can make a big difference. In fact, by reviewing the data a little, it may be possible to avoid the trouble of acquiring data again.
1. Eliminating Noise and Other Unwanted Peaks
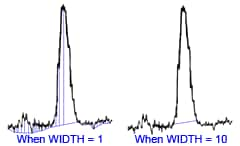
Width Value and Peak Detection
In some cases, peaks are not integrated correctly because target peaks contain noise. In such cases, verify that the peak integration parameters (or peak integration commands) in the method (analytical file) used to analyze data are appropriate. In some cases, the way the peak is detected can be changed by changing the width setting, as shown on the right.
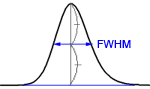
FWHM
Normally, unwanted noise or other peaks can be eliminated by setting [WIDTH] (units: seconds) greater than the full width at half maximum (FWHM) of the unwanted peaks or setting [SLOPE] (units: µV/sec) greater than the leading slope of the unwanted peaks.
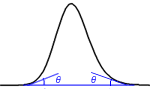
Slope of Peaks
(In LCsolution, [WIDTH] and [SLOPE] settings can be set by clicking [Method] - [Data Analysis Parameters] - the [Integration] tab.)
Note: Rather than changing the peak integration parameters for each set of data, set those parameters when developing a method so that peaks can be integrated using the same peak integration parameters for all data measured under the same analytical conditions.
2. Integration of Unseparated Peaks
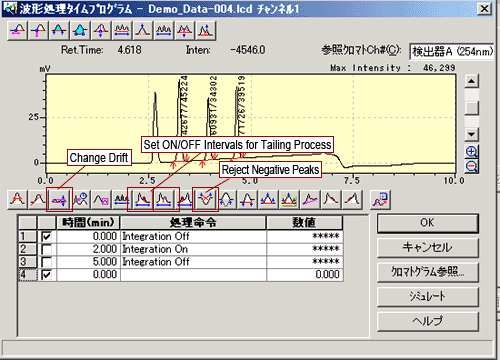
• Using Time Programs
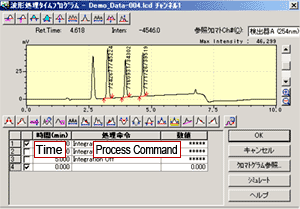
LCsolution [Integration Time Program]
Even if appropriate integration is not possible using regular peak integration parameters, appropriate integration may be possible using a time program that specifies integration at specific times ([Integration Time Program] in LCsolution).
Figures A through D show how the method used to integrate peaks in the same chromatogram can have a large effect on area values.
In Figure A, a baseline correction line is drawn from an unwanted negative peak, so that calculated peak areas are excessively large. If the [Negative Peak Reject] is specified in the time program (starting after 0.5 minutes and clearing after 2 minutes), the effects of negative peaks are eliminated, as shown in Figure B.
(In LCsolution, negative peaks can be rejected by specifying
[Negative Peak Reject]
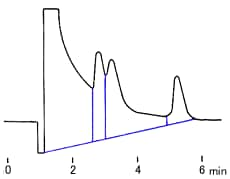
Fig. A Without Rejecting Unwanted Negative Peaks
Next, changing the [Drift] setting (see figure below) allows selecting either vertical partitioning (Fig. B) or baseline partitioning (Fig. C).
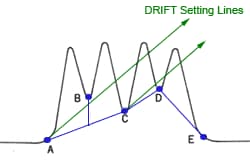
Relationship Between the DRIFT Setting Lines and Baseline Correction Line
- Since point B is higher than the DRIFT setting line from point A and point C is lower, the baseline correction line is line A-C.
- Since point D is lower than the DRIFT setting line from point C, the baseline correction line is line C-D.
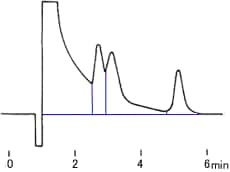
Fig. B Vertical Partitioning
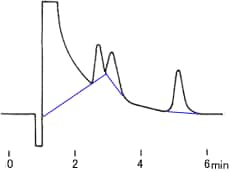
Fig. C Baseline Partitioning
(In LCsolution, the DRIFT lines can be changed via the [Drift] setting.)
If forced tailing is used (starting after 2 minutes and clearing after 6 minutes), peak integration is performed as shown in Figure D. With forced tailing, peaks in other unspecified intervals are partitioned vertically, even if they have a tailed shape.
(In LCsolution, forced tailing can be specified via the ON/OFF interval setting at [Tailing].)
These peak integration commands and parameter changes can be specified not just once, but many times using peak integration time programs.
(It is recommended that appropriate peak integration parameters be considered during method development.)
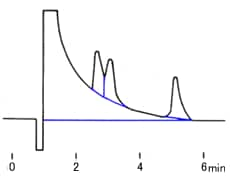
Fig. D Forced Tailing
• Using Manual Peak Integration
Ideally, the same peak integration parameters should be used to analyze data acquired under similar analytical conditions. However, in some cases the desired peak integration results cannot be obtained using these peak integration time programs or it is desirable to move the peak detection point of individual peaks. In such cases, the baseline correction line can be changed manually by setting peak integration parameters (or peak integration commands) for individual sets of data.
To distinguish it from setting peak integration parameters (or peak integration commands) for methods, it is referred to as manual peak integration.
Therefore, as described above, one of the factors that determine peak area reproducibility can be eliminated by paying careful attention to peak integration settings.