Formula for Calculating the Number of Theoretical Plates
Introduction
N, the number of theoretical plates, is one index used to determine the performance and effectiveness of columns, and is calculated using equation (1).

・・・1) where tr: retention time, and W: peak width
This peak width, W, is based on the baseline intercepts of tangent lines to a Gaussian peak, which is equivalent to the peak width at 13.4 % of the peak height.
However, to simplify the calculation and accommodate non-Gaussian peaks, the following calculation methods are used in actual practice.
Fig. 1 Peak Width
1. Tangent Line Method
Peak width is the distance between points where lines tangent to the peak's left and right inflection points intersect the baseline, and is calculated using equation (1). The USP (United States Pharmacopeia) uses this method. This results in small N values when peak overlap is large.
This also presents a problem if the peak is distorted, so that it has multiple inflection points.

・・・1)
2. Half Peak Height Method
Width is calculated from the width at half the peak height (W0.5). Since width can be calculated easily by hand, it is the most widely used method. This is the method used by the DAB (German Pharmacopeia), BP (British Pharmacopeia), and EP (European Pharmacopeia).

・・・2)
The Japanese Pharmacopoeia 15th revision issued in April 2006 changed the coefficient from 5.55 to 5.54.
(LCsolution allows selecting the coefficient via the [Column Performance] setting, where the calculation method for 5.54 is "JP" and for 5.55 is "JP2."
For broader peaks, the half peak height method results in larger N values than other calculation methods.

・・・2)
3. Area Height Method
Width is calculated from the peak area and height values. This method provides relatively accurate and reproducible widths, even for distorted peaks, but results in somewhat larger N values when peak overlap is significant.

・・・3) A: Area, H: Height
4. EMG Method (Exponentially Modified Gaussian)
This method introduces parameters that accommodate the asymmetry of peaks, and uses the peak width at 10 % of the peak height (W0.1). Since it uses a width near the baseline, it results in N values larger than other methods for broad peaks. Furthermore, it cannot calculate the width unless the peak is completely separated.
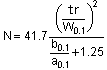
・・・4) a0.1: Width of first half of peak at 10 % height b0.1: Width of second half of peak at 10 % height
Comparison of Calculation Methods
Given a Gaussian peak, each of these calculation methods results in the same N value. However, normally peaks tend to have some tailing, which results in different N values for different calculation methods.
Therefore, the four calculation methods were compared using chromatograms. Profile A shows a typical chromatogram (with some tailing), whereas profile B shows a chromatogram with significant tailing. The theoretical number of plates calculated using the four methods are indicated in the table below. Results for N varied even for chromatogram A. Also, peaks with more significant distortion, such as at peak 1 in profile B, can result in N values that differ by many times.
A key factor for performing reliable quantitative analysis is whether or not separation is possible, so there is a common opinion that a calculation method that judges broader peaks, such as with tailing, more severely is more practical. However, unfortunately, there seems to be no consensus on opinions regarding N and W.
Consequently, if a certain method is already being used for evaluation, then to achieve correlation, it is probably preferable to keep using the same method.
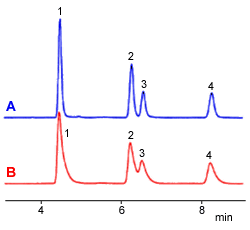
Fig. 2 Chromatograms
| A (roughly typical peak) | B (significant tailing) | |||||||
| 1 | 2 | 3 | 4 | 1 | 2 | 3 | 4 | |
| Half Peak Height Method | 15649 | 20444 | 20389 | 22245 | 5972 | 7917 | - | 9957 |
| Tangent Line Method | 14061 | 18516 | 20309 | 21447 | 5773 | 7692 | 5795 | 9707 |
| Area Height Method | 13828 | 19207 | 17917 | 21020 | 4084 | 7845 | 6217 | 8641 |
| EMG Method | 10171 | 15058 | 14766 | 17836 | 1356 | - | - | 4671 |
Shimadzu's LC workstation software is able to output performance reports using any of the methods indicated above - 1. tangent line, 2. half peak height (5.54), 2'. half peak height (5.55), 3. area height, or EMG. We recommend recording the corresponding column performance results along with analytical results!