Utilization of Diffracted/Scattered Light Intensity Distribution Data - Part 4
When a sample having an extremely steep distribution (i.e. extremely narrow distribution width), such as polystyrene latex standard particles, is measured, not only a first peak but also a first bottom appears as shown in Fig. 1 for the light intensity distribution pattern of the detected diffracted/scattered light.
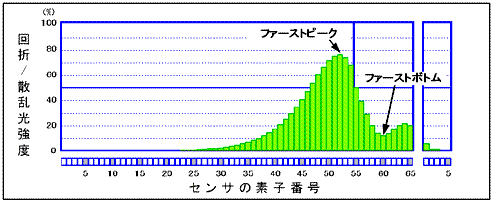
Fig. 1 First Peak and First Bottom
To clarify the relationship between particle size distribution width and the light intensity distribution data of diffracted/scattered light, we tried obtaining the light intensity distribution data for particle size distributions of the same average particle size but with three different distribution widths as shown in Table 1 and Fig. 2. Fig. 3 shows the results of this.
Because it is difficult to prepare actual samples with the same average particle size but with just differing particle distribution widths, we used computer simulation to obtain the light intensity distribution data detected when particles with an average particle size of 2 µm and a refractive index of 1.60-0.1i were dispersed in water. The three distributions are assumed to be symmetrical about the average particle size as shown in Fig. 2.
Also, a model equivalent to the SALD-2200 laser diffraction particle size analyzer is used in the simulation as the diffracted/scattered light detection optical system.
Table 1 Particle Distribution Width Conditions
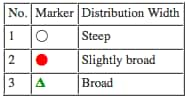
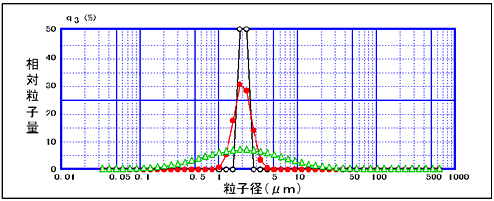
Fig. 2 Particle Size Distributions with Different Distribution Widths
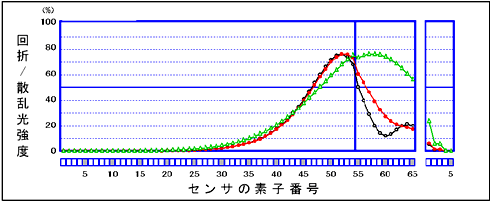
Fig. 3 Comparison of Light Intensity Distribution Data of Diffracted/Scattered Light
As is clear from Fig. 3, in the case of steep distributions, not only a first peak but also a first bottom appears. However, when the distribution width broadens, the first bottom disappears though the first peak still remains. When the distribution width broadens further, the position of the first peak can no longer be identified.
As introduced in "15 Utilization of Diffracted/Scattered Light Intensity Distribution Data (Part 2)," the position (or, the No. of the sensing element in the sensor) of this first peak has an almost 1:1 correspondence relationship with the average particle size. In other words, since the position of the first peak changes according to the average particle size of the measurement target, if multiple samples to be used as the reference are measured in advance to investigate the "correspondence relationship between the first peak and average particle size," this relationship can be made use of as a means of verifying the appropriateness of the measurement results of particle size distribution. Furthermore, if a first bottom exists, it can be seen that the sample has an extremely steep distribution width. And, if the first peak becomes ambiguous, information on the average particle size cannot be obtained, but at least it can be seen that distribution is fairly wide.
In this way, important information about particle size distribution can be elicited directly and intuitively from the light intensity distribution data of diffracted/scattered light regardless of the refractive index conditions or particle size distribution calculation algorithm (software). The appropriateness of the particle size distribution data obtained (calculated) as a measurement result can be verified based on this information.