High Spatial Resolution Imaging by iMScope TRIO - Imaging of Quercetin Distribution in Mouse Liver -
Since the emergence of imaging mass spectrometry (MS) technology that can visualize the spatial distribution of exogenous molecules in tissues, label-free drug imaging by imaging MS i s an increasingly growing field of pharmacokinetic research. It is advantageous over conventional methods in that MS can resolve between intact and metabolized forms of candidate drug compound and quantify multiple targets simultaneously. iMScope TRIO is an "imaging mass microscope" instrument that coupled optical microscopy to MS with minimum laser diameter of 5 μm to enable precise overlay of optical and MS images at high spatial resolution.
Moreover, MS/MS data acquisition ensures that the detected signal is derived from the compound of interest, while eliminating interfering noise to achieve high sensitivity. These features drive drug imaging investigation to a breakthrough and speed up the drug development process. Here we present an example of investigation using iMScope TRIO, focused on the imaging of quercetin distribution in mouse liver.
*Sales area: All areas excluding North America
Detection of Quercetin Directly from Mouse Liver
Described below is the analysis workflow of imaging MS experiment.
(1) Preparation of sample section
(2) Acquisition of optical image
(3) MALDI matrix deposition
(4) MS and MS/MS acquisition
First, a large area of interest was selected to scan for tissuewide distribution of quercetin. A 2.5 x 2.5 mm area contains 10,000 pixels when acquired at 25 μm acquisition pitch. Spatial resolution can be adjusted according to time allowance (10,000 pixels take about 30 minutes).
Fig. 1 shows the averaged MS spectrum acquired from the tissue section. A single mass peak was observed at m/z 269.22. Fig. 2 shows the abundance of this signal over a large area of liver tissue. The signal seemed to be tissue-derived, though we could not relate its distribution to tissue appearance at 25 μm spatial resolution.
Next, we acquired similar data by MS/MS mode and searched for differentially expressed product ions.
The result, displayed in Fig. 3, demonstrated that production m/z 224.97, derived from quercetin, was localized on tissue whereas m/z 226.07 was randomly distributed (probably matrix derived). MS/MS mode thus eliminates the effect of noise and improves the specificity of target-derived signal.
Table 1 Analytical Conditions
| Sample Type and Preparation | |
| Sample | Quercetin administered mouse liver (50 mg/kg: iv) |
| MALDI Matrix | CHCA applied by sublimation |
| MS Acquisition | |
| Polarity | positive mode |
| Range | m/z 100-500 |
| Laser Diameter | 25 μm |
| Acquisition Pitch | 25 μm |
| Area of Interest | 100 x 100 (10,000 pixels) |
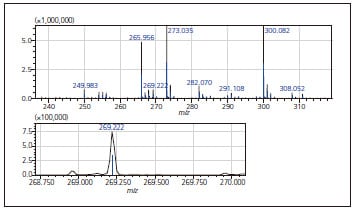
Fig. 1 Averaged Mass Spectrum Acquired from Liver Tissue (top: all m/z range, bottom: target peak magnified)
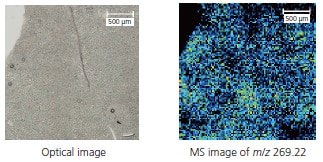
Fig.2 MS Imaging of Mouse Liver, Showing the Spatial Distribution of Quercetin (m/z 269.22)
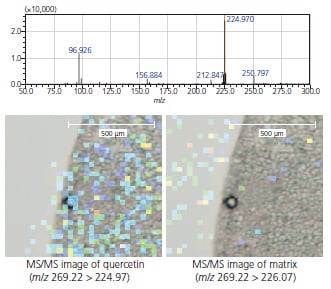
Fig. 3 MS/MS Product Ion Spectrum Acquired on Tissue (top) and Distribution of Product Ions (bottom)
iMScope TRIO
Imaging Mass Microscope
Imaging mass spectrometry is a revolutionary new technology.
The instrument is a combination of an optical microscope which allows the observation of high-resolution morphological images, with a mass spectrometer which identifies and visualizes the distribution of specific molecules.