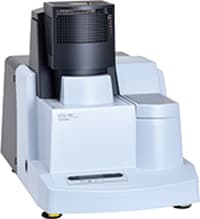
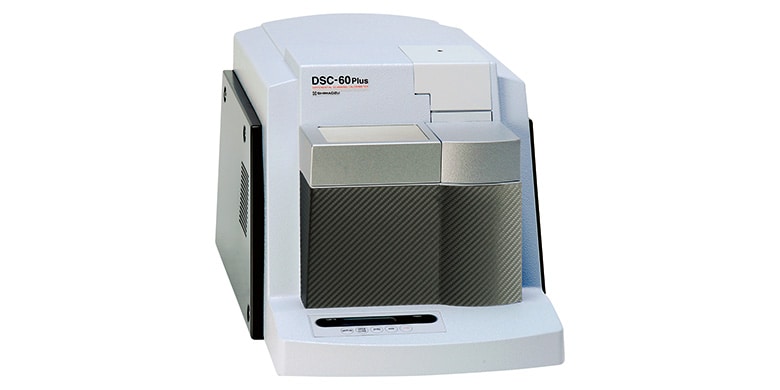
LabSolutions TA - Options

Workstation Software for Thermal Analyzer

Optional Software

A variety of optional software is available for LabSolutions TA, providing excellent operability and functionality, and further expanding the range of applications.

Temperature-Modulated DSC Program

PET Glass Transition Measurements

Using temperature-modulated DSC measurements, you can separate complex data such as overlapping transitions and reactions, and can measure specific heat. For specific heat measurements, the number of measurement cycles is fewer than with standard DSC measurements, the process is easier, and pseudo isothermal measurements, which were impossible with standard DSC, can now be performed.
Temperature-modulated DSC measurements achieve both high resolution and high sensitivity, which have been difficult to achieve with standard DSC measurements, enabling higher accuracy measurements.

Partial Area Analysis Program

Fusion of Chocolate

This software can calculate partial fusion rates at various temperatures, and find the temperature at which the specified partial fusion rate is shown, for use as a quality control index.

Purity Analysis Program

Purity of Benzoic Acid

In measurements of purity using DSC, pretreatment of samples is not required, even for trace samples, and the purity is obtained quickly and with easy operations. It is widely used for analysis of pharmaceuticals, industrial chemicals, and reagents.
With calculations by this program, the purity can be calculated accurately, even for materials that degrade during fusion.

Dynamic Temperature Control Program

Dehydration of Copper Sulfate
(Dynamic/Temperature Increases at a Constant Rate)

Controls the temperature that switches between high and low rise speeds in a temperature program, corresponding to the rate of change of the TG weight signal and the TMA displacement signal. In comparison to measurements in which the temperature rises at a constant rate, the sof tware is useful for improving the resolution with multi stage changes in TG, and for sintering conditions for ceramic materials in TMA.

Specific Heat Analysis Program

SBR Specific Heat Measurements

To measure the specific heat of samples using DSC, a comparison of the calorific values of three measurement results (a blank, a standard, and the sample) is calculated.
With this program, the above-mentioned calculations are automated, so finding the specific heat is easy. In addition to determining the desired specific heat at each temperature, the program can also calculate the specific heat simultaneously at preset temperatures (up to 15 temperatures).

Stress-Strain Analysis Program

Young's Modulus for Magnetic Tape

The stress versus strain curve for materials can be obtained by plot ting the data measured with TMA (time/temperature, displacement and load) with strain on the horizontal axis and stress on the ver tical axis, thereby learning the temperature change in Young's modulus and averaged Young's modulus for films and fibers.
In addition, up to 12 analyzed stress-strain curve data sets can be overlapped.

Reaction Rate Analysis (TG) Program

Analysis of the Reaction Rate of Nicotinamide

This software analyzes the data from the decomposition reaction of a sample, obtained from thermogravimetry, using the Ozawa method. It then obtains the activation energy, the frequency factor and other reaction rate parameters. It is applied to estimations of reaction mechanisms, evaluation of the thermostability of materials, and estimations of material operating life.
It can be used for a wide range of samples, including high molecular weight materials, electrical insulation materials, thermally stable polymers, composite materials, and pharmaceuticals.

Reaction Rate Analysis (DSC) Program

Reaction Rate Analysis of an Epoxy Resin

This software is applied to the analysis of reaction rates for chemical reactions (such as the curing of epoxy resins) without changes in weight. As when using TG, the analysis is per formed via the Ozawa method. Using the DSC data measured by changing the heating rate, an Ozawa plot is charted, and the activation energy, frequency factor, and other reaction rate parameters are obtained. As an example, the figure shows a reaction rate analysis of the curing reaction for an epoxy resin.
The relationship between the curing temperature, curing time, and degree of curing can be simulated based on the parameters obtained.

Note: Analysis can also be performed for the DTA signal, but the photometric accuracy is not guaranteed.

Related information