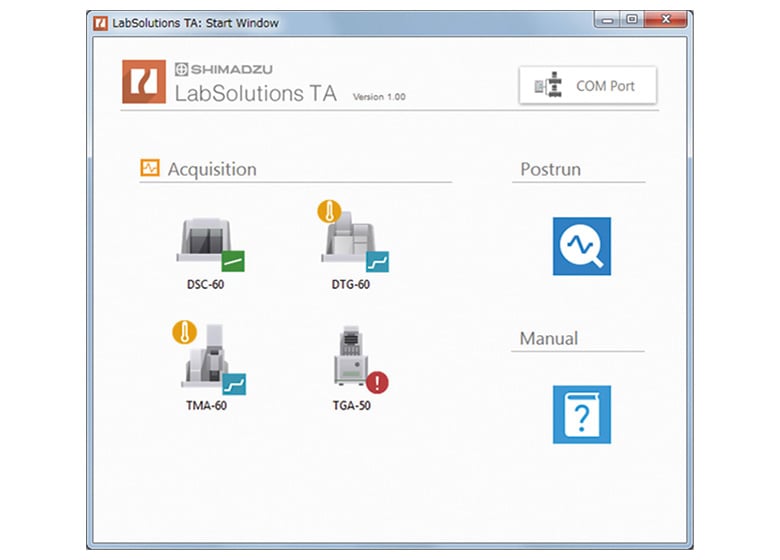
Improved operation through clear design
Enables intuitive mouse operations
Operational status of instruments can be checked at a glance
Enables intuitive mouse operations
Operational status of instruments can be checked at a glance
Workstation Software for Thermal Analyzer
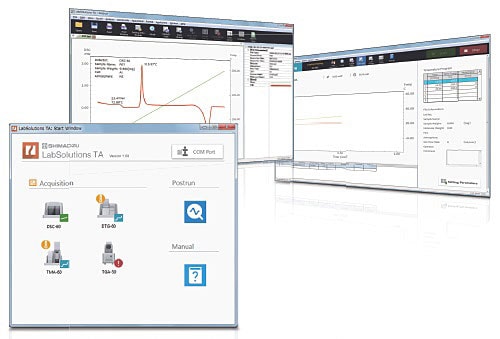
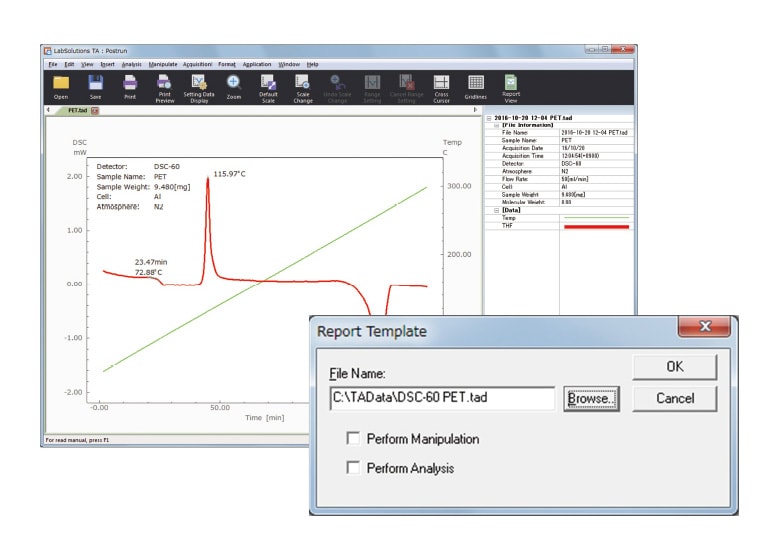
A new design and enhanced functions that can be used at a glance. Intuitive operations that allow seamlessly performing the sequence of processes from measurement to analysis, and the outputting of reports.
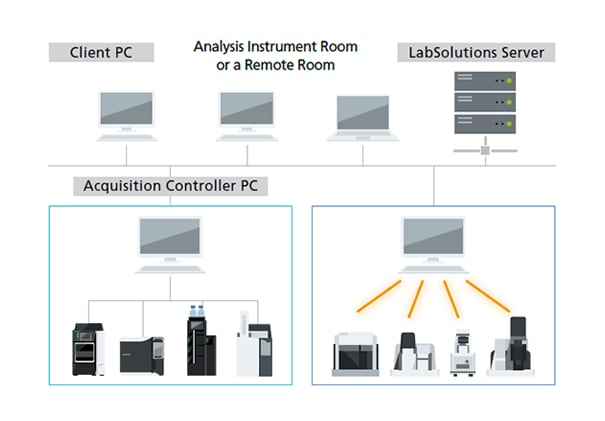
As part of the LabSolutions™ family, this software is network compatible.
Enhanced Operability Workstation for Thermal Analyzers
Shimadzu has released the LabSolutions i-QLinks.
LabSolutions™ i-QLinks provides integrated control over the quality testing operations of an analytical laboratory, including the preparation of test plans and instructions, the incorporation of test results from analytical instruments such as HPLC, the automatic preparation of test reports from the incorporated test results, and the management of the quality test progress.
Shimadzu has released the LabSolutions Sync
Synchronizes Third-Party Software for Pretreatment Units with Shimadzu LC and LC-MS
Efficient Method Development by automated pH Screening with LabSolutions MD
This article describes an example of using LabSolutions MD, a dedicated software for supporting method development, to automate pH screening by varying the mobile phase pH from 2.5 to 8.5 to evaluate the optimal pH level for separating 12 small-molecule drugs.
Release of Six New AP-AD Series Analytical Balances
The new AP-AD series models not only offer excellent basic performance, such as fast weighing times of about two seconds and high measurement stability that minimizes errors, but also include new functionality that improves convenience, such as automatic doors and touchless sensors.
Shimadzu has released the LabSolutions DB GCMS for GCMS-QP series
GC/MS software for secure database management in compliance with regulations.
What you should know to assure laboratory data integrity with LabSolutions