Particle Size Analysis for Food & Beverage
Particle Size Analysis for Food & Beverage
“Texture” is an important factor when evaluating how good food and beverages are.
The human tongue is so sensitive it is said that it can even recognize particles of several 10 µm on contact. In fact, a few 10 µm is enough to feel “rough” on the tongue. To achieve a smooth feeling, such as when eating chocolate, particles must be kept down to about 20 µm.
In this way, texture is closely related to the taste of food, particle size is closely related to texture, and measurement of particle size is a way to quantify texture. Thus, for foods and beverages, measuring particle size is important since it determines texture and greatly impacts taste perception.
Chocolate is a mixture of ground cocoa beans mixed with milk, sugar, cocoa butter, and other ingredients. Fig.1 shows the result of particle size analysis of three types of chocolates. The chocolate A particle size, indicated by the black line, is distributed over a smaller range, and the chocolate C particle size, indicated by the green line, is distributed over a larger range than the other two chocolate types.
The results of the sensory evaluation of the texture in each chocolate showed that Chocolate A was very smooth, Chocolate B was slightly grainy, and Chocolate C was noticeably grainy.
Measurement of particle size distribution can be a means of evaluating the taste of chocolate.
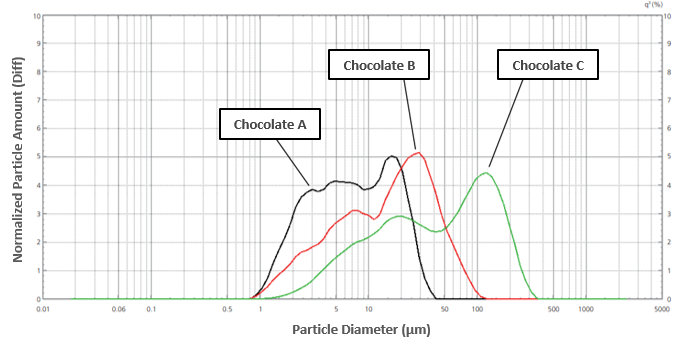
Fig.1 Particle Size Distributions of Several Kinds of Chocolate
Learn more:
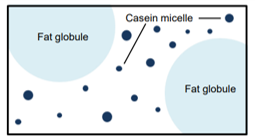
Fig.2 Main Structural Components of Milk
Milk is a natural occurring oil in water emulsion, in which the fat globules are dispersed in a continuous phase of milk plasma containing lactose, protein, vitamins, and minerals. The main structural components of milk are fat globules and casein micelles as shown in Fig.2. The fat globules are surrounded by the milk fat globule membrane which acts as an emulsifying agent that prevents aggregation and coalescence of milk fat. The particle size distribution of these fat globules ranges from 1 μm to 10 μm, dependent on the cow breed and seasons. On the other hand, casein protein in the form of spherical micelle structure are mostly in the range of 40 nm to 300 nm in diameter.
Fig.3 shows the result of a particle size analysis of four types of milk samples. The particle size in unhomogenized fresh milk has the largest range among the samples due to the large fat globules present in the milk. This result shows how homogenization reduces the size of fat globules.
Most of the fat globules are removed in low-fat milk, resulting in a decrease for the ration of fat globules to protein casein micelles. This is reflected in the measured particle size distribution of low-fat milk as shown in the red line. This is because skim milk has predominantly protein casein micelles and is nearly absent of fat globules.
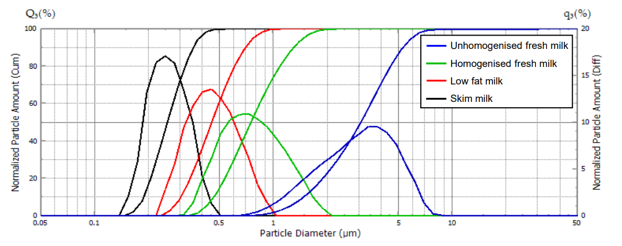
Fig.3 Particle Size Distributions of Different Types of Milk
Lean more:
Fig. 4 shows the measurement results of two types of yogurt. Particles 20 μm and larger were not detected in the drinkable yogurt. However, in the solid type yogurt, particles which were thought to be aggregates of proteins can be observed in the particle images, and particles with sizes of 20 μm and larger can also be seen in the particle size distribution. Thus, it can be understood that particle size in the drinkable yogurt was reduced to avoid the feeling of solids on the tongue.
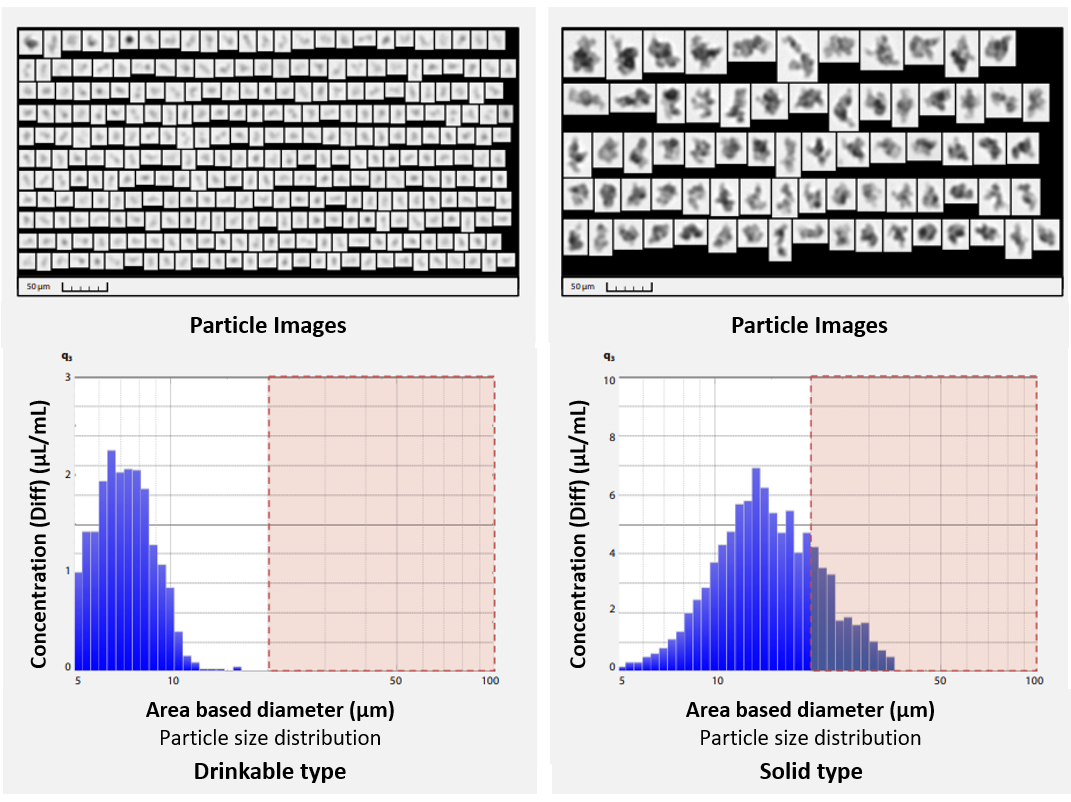
Fig.4 Measurement Results of 2 Types of Yogurt
Learn more :
In recent years, the introduction of digital transformation in the research and development of food and beverage products has seen an increase in efforts to visualize palatableness. It is important for the visualization of palatableness to know the quantitative parameter of texture as well as taste and flavor. Particle size analysis provides quantitative data on the texture of various foods and beverages by acquiring the data of the particle size distribution and the images of particle shape.
Characterisation of Casein Micelles and Fat Globules in Milk by Particle Size Laser Diffraction Method ![]() (341KB)
(341KB)