Standard Deviation
Just like average values, there are various ways of considering the standard deviation of particle size distribution. Since the SALD Series of laser diffraction particle size analyzers use particle size graphs where particle sizes are indicated on a logarithmic scale, a standard deviation defined on the logarithmic scale is used so that it better matches the expression of this graph.
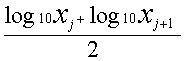
First, the particle size range (max. particle size: x1, min. particle size: xn+1) to be measured is divided into n separate intervals, and each of these particle size intervals is taken to be [xj, xj+1] (j = 1,2,... n). The intervals in this case are equal divisions on the logarithmic scale. And, the representative particle size at each, individual particle size interval can be calculated as follows based on the logarithmic scale:
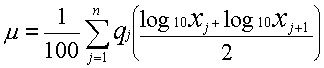
Furthermore, let's take qj(j = 1,2,... n) to be the normalized particle amount (difference %) corresponding to each of particle size intervals [xj,xj+1] and the total of all intervals to be 100%. Average value µ on the logarithmic scale can be calculated as:
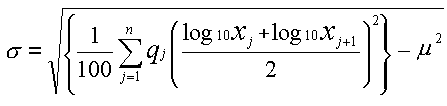
The standard deviation defined on the logarithmic scale can be calculated as follows based on this µ:
In the case of the average value, an average value of particle sizes on a normal scale could be calculated by 10µ(10 to the power of µ). However, in the case of the standard deviation defined on the logarithmic scale, it is pointless to simply calculate 10σ(10 to the power of σ).
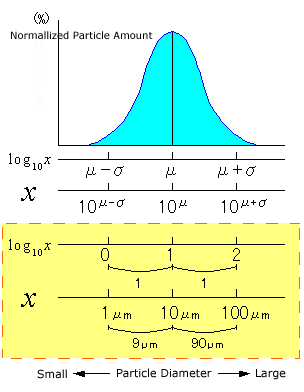
The particle size intervals corresponding to the intervals [µ-σ, µ+σ] on the logarithmic scale become
[10µ-σ, 10µ+σ] as shown in the figure.
For example, when the average value is 10 µm, µ=1 is applied on the logarithmic scale. If the standard deviation on the logarithmic scale at this time is taken to be σ=1, then the particle size intervals corresponding to [µ-σ, µ+σ] become [1 µm, 100 µm].
In this instance, the distance between 1 µm (µ-σ point) and average value 10 µm is 9 µm, and the distance between 100 µm (µ+σ point) and average value 10 µm is 90 µm.
In this way, the distances on the left and right are completely different when points µ-σ and µ+σ, that are at equal distances from average value µ on a logarithmic scale, are converted to particle size values on a normal scale.