Nucleic Acid Thermal Stability Analysis (Tm Analysis)
Techniques such as PCR and DNA microarray that are based on hybridization of nucleic acids are indispensable to life science research. In addition, functional nucleic acids, including nucleic acid drugs and siRNA (small interference RNA), are receiving considerable attention. Thermal stability analysis (Tm analysis) is indispensable for the research, development, and as well as application of nucleic acids.
DNA typically has a double-stranded helix structure. The double strand comprises a sense strand and an antisense strand made up of the complementary bases, G (guanine) and C (cytosine), and A (adenine) and T (thymine), respectively, and these complementary base pairs are joined by a hydrogen bond. When the temperature is raised, the hydrogen bond is broken, the double strand dissociates, and a single-stranded structure is formed. This phenomenon is referred to as "melting".
Nucleic acids display an ultraviolet absorption peak at 260 nm, and their absorbance at 260 nm increases when melting occurs. The data curve acquired when measuring UV absorbance with respect to temperature rise is called a UV absorbance melting curve. In addition to UV absorbance measurement, melting curves are also obtained in other types of measurement, such as circular dichroism spectroscopy and thermal measurement. At the melting temperature (Tm), the ratio of the double strands to the single strands becomes equal. Tm is an index of the thermal stability of a nucleic acid, and is dependent on such conditions as the base sequence, base number, nucleic acid concentration, solvent conditions (salt composition, organic solvent composition, pH), mismatch (non-complementary base pairs), nucleic acid analog (artificial nucleic acid) structure, etc.
In contrast to the melting process, lowering of the temperature will cause a single-stranded nucleic acid to adopt a double-stranded structure through the reinstatement of the hydrogen bonds between the complementary base pairs. The phenomenon is referred to as hybridization. Hybridization of nucleic acids is utilized in PCR, DNA microarray, southern hybridization, northern hybridization, and in situ hybridization, etc. In addition, nucleic acids (functional nucleic acids) which possess functionality associated with siRNA, antisense nucleic acids, antigene nucleic acids, ribosomes, etc., are applied in various fields, including drug discovery research, drugs, and diagnostics.
Thermal stability of nucleic acid is an important factor that controls the structure, hybridization, and functions of nucleic acids; therefore, thermal stability analysis of nucleic acid (Tm analysis) is indispensable in these fields.
Below is a simple description of nucleic acid thermal stability analysis (Tm analysis). Here, it is assumed that there is a state of equilibrium between the 2 different single-stranded (A1, A2) and double-stranded (A1A2) states, and that the concentrations of A1 and A2 are the same.
If the double-stranded molar fraction is α, and the total nucleic acid concentration is Ct, the equilibrium constant K for the system is expressed as follows.
The observed absorbance (Aobs) at 260 nm is expressed as follows.
εds, εss and L express the double-strand molar absorption coefficient, single-strand molar absorption coefficient, and pathlength, respectively.
As shown in the melting curve of Fig. 1 obtained from actual measurement, εds and εss are temperature-dependent. Since the absorbance changes linearly to a greater extent in the low-temperature, pre-transition region (region prior to large absorption change) and high-temperature post-transition region as
compared to during the transition region itself (region of large absorption change), εds and εss are expressed as follows, where T represents temperature.
εds = ads + bdsT (4)
εss = ass + bssT (5)
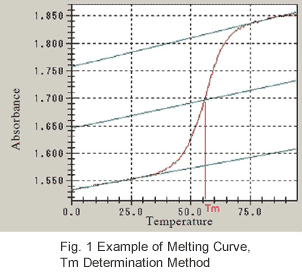
The temperature becomes Tm when α = 1/2, and this is what is used to determine Tm (melting temperature) from the melting curve. As shown in Fig. 1, the baseline is determined with respect to the pre-transition region and post-transition region. Next, the median of the 2 baselines is drawn, and the temperature (Tm) at which this line intersects with the melting curve is obtained.
Gibbs change in free energy, change in enthalpy and change in entropy, ΔG, ΔH, and ΔS, respectively, are used to express the basic principle of thermodynamics, in which the following expression is obtained when the change in molar specific heat (ΔCp) is zero. R is the gas constant.
Substituting expression (2) for expression (6), the following expression is obtained when α = 1/2 at temperature Tm.
The samples are prepared at the various concentrations (Ct), the respective Tm values are obtained, 1/Tm is plotted with respect to ln(Ct/4), and ΔH and ΔS are determined from the obtained slope of the straight line and the y intercept.
Shimadzu offers a Tm analysis accessory option for its wide array of double-beam UV-VIS spectrophotometers (UV-1800/UV-2450/UV-2550, etc.) that ensures stable thermal analysis of nucleic acids. The Tm analysis system (TMSPC-8) comprises a thermoelectrically temperature-controlled 8-series micro cell holder, a temperature-controller, an 8-series micro multi-cell (pathlength 10 mm, 1 mm), and specially designed Tm analysis software. The 8-series cell allows simultaneous thermal melting analysis for up to 8 samples.
Shown below are examples of Tm analysis data and the results of thermal stability performance analysis.
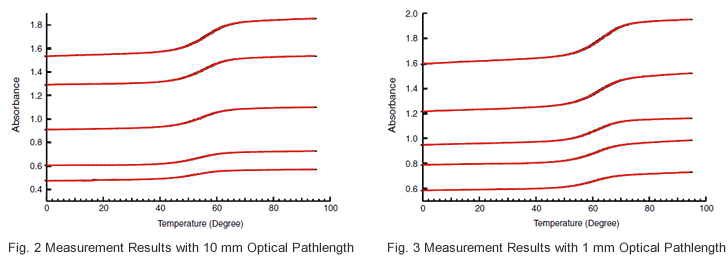
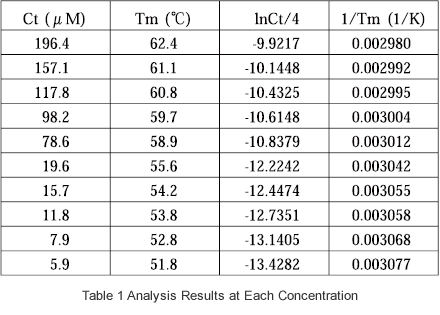
Using a sample consisting of GCGAAAAGCG/CGCTTTTCGC, data was acquired from measurement of 10 samples having different concentrations. The concentrations are listed in Table 1. Cells with an optical pathlength of either mm or 1 mm were used depending on the absorbance of the sample. The obtained data are shown in Fig. 2 and Fig. 3, and the measurement conditions are shown in below.
| Buffer | : 100mM Sodium Phosphate, 1M NaCl, 0.5mM EDTA, pH7.0 |
| Wavelength | : 260nm, 320nm |
| Temperature Range | : 0 to 95°C |
| Ramp Rate | : 1°C/min |
| Sampling Interbal | : 0.5°C |
| Waiting Time | : 30sec |
| Post-Process Annealing | : (95°C, 2min) |
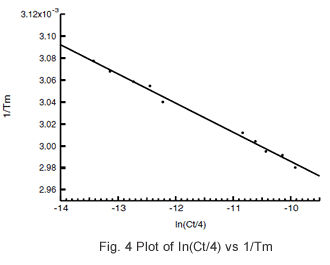
The Tm analysis software was used to determine the Tm value at each concentration, and calculate 1/Tm and ln(Ct/4). The data of Table 1 were plotted, and the linearity of Fig. 4 was obtained. Using the slope and y intercept of this straight line, -74.6 kcal/mol and -202.9 cal/(molK) were obtained for ΔH and ΔS, respectively.
In addition to the above-mentioned ΔH and ΔS determination method, the melting curve nonlinear fitting method can also be used for determination of ΔH and ΔS.