Food Textures
Food texture, including crunchiness, elasticity, and the feeling of food on the tongue, are important factors that, together with flavor and aroma, impact the tastiness of food.
Food texture is typically evaluated using sensory testing. However, achieving repeatability is difficult due to individual differences in human senses and physical condition.
Shimadzu texture analyzer and particle size analyzers complement sensory testing and are used as a method of obtaining objective numerical results in the field of food development.
Crispiness, Chewiness, and Crunchiness
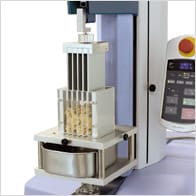
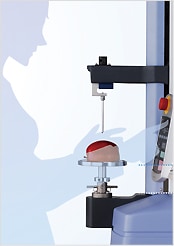
Quantifying Mechanical Properties: Texture Analyzer
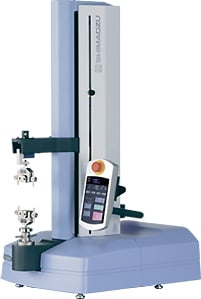
The texture of food, such as its crispiness, chewiness, and crunchiness, is closely related to its mechanical properties. Using compression, shear, and piercing, Texture Analyzer applies deformations to food materials and evaluates the physical properties and texture of the food materials.
A lineup of various evaluation jigs is available, designed to take into account the characteristics and shapes of foods and enable users to obtain measurement results that correlate highly with sensory evaluation tests. Various food materials can be measured by changing the jigs and the measurement conditions.
-

Compression Test Evaluation of Bread -
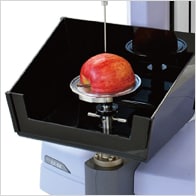
Surface Hardness Test Evaluation of Apples -
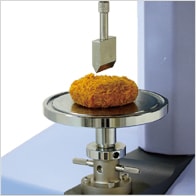
Shear Test Evaluation of Croquettes -
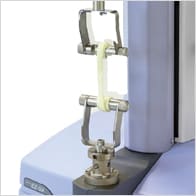
Tensile and Shear Test Evaluation of Noodles -
Compressed Shear Test Evaluation of Cereals
Food Materials
- Note:
- Select the video by clicking on the [Playlist] icon in the top right corner of the video player above.
| 1 | Shear test of azuki beans |
|---|---|
| 2 | Shear test of asparagus (blade jig) |
| 3 | Shear test of asparagus (volodkevich bite jig) |
| 4 | Surface hardness piercing test of apples |
| 5 | Viscosity evaluation of honey |
Processed Foods
- Note:
- Select the video by clicking on the [Playlist] icon in the top right corner of the video player above.
| 1 | Food texture evaluation of Castella cake |
|---|---|
| 2 | Bending (strength) test of cookies |
| 3 | Piercing test of jam |
| 4 | Shear test of cereals |
| 5 | Cracking evaluation of snack confectioneries |
| 6 | Shear test of sausages |
| 7 | Shear test of cheese |
| 8 | Surface hardness test of cheese |
| 9 | Spreading test of butter |
| 10 | Hardness test of butter |
| 11 | Shear test of butter |
| 12 | Compression test of foods for people with aphagia |
| 13 | Compression test of white bread (AACC standard method) |
| 14 | Hardness evaluation of sheets of chewing gum |
| 15 | Tensile test of noodles |
Prediction of Sensory Evaluation Values for Confectionery (Cookies) by Multivariate Analysis
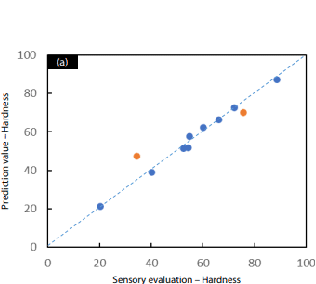
Sensory evaluation values were predicted for cookies using the EZTest texture analyzer. Tests were conducted using three methods: compression testing, piercing testing, and 3-point bending testing. A predictive model for sensory evaluations was created by performing multiple regression analyses using explanatory variables based on the compression testing results, which had the highest correlation with the sensory testing. When the actual sensory tests were evaluated, the results suggested that the model was sufficiently predictive.
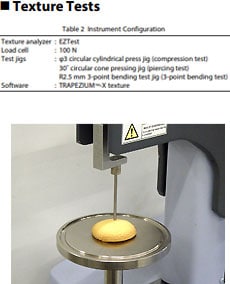
Testing Conditions
Compression Test

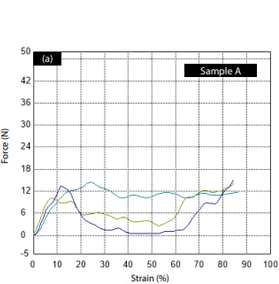
Compression Test Results
Example of a Test Force Versus Strain Diagram
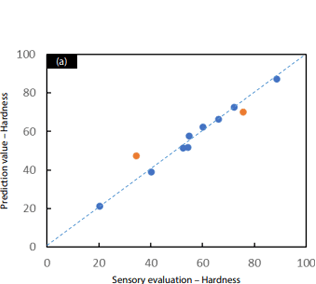
Multiple Regression Analysis Results
Example of a Correlation Diagram between Sensory Evaluations and Predictive Values
Related Information
-
- EZ-Test Series
- Single-Column Compact Design. Two-Model Lineup: 5 kN and 500 N capacity can be applied to strength testing of a variety of materials and parts, including electronic components, food textures, medical equipment, rubber, and plastics.
- Product Information
-

- Meat Substitutes Evaluation Applications
- In recent years, meat substitutes have been developed that artificially reproduce the texture, flavor, and appearance of meat. There are two types of meat substitutes: plant-based meat, which has as its main ingredient plant proteins from soybeans, peas, or mushrooms, and cultured meat, in which stem cells from cows or other animals are cultivated and produced. Both types of technology are sparking interest in food markets throughout the world. This collection of applications summarizes evaluations of the tastiness of meat developed as meat substitutes.
- Download Materials
Tongue-feel and Smoothness
Evaluation of Particle Size: Particle Measurement Instruments
In food products, the particle size distribution is said to affect the feeling on the tongue, the crunchiness, and other aspects of food texture. The human tongue is very sensitive, and it is said to be able to recognize particles just a few dozen μm in size or larger on contact. Particle size distribution is an important factor in food product development. For example, depending on the type of food, a smooth texture can be created by making the particles smooth and uniform. Conversely, subtle textures can be created by making the particles large and uneven. The SALD-2300 laser diffraction particle size analyzer can measure a wide range of particles, from 17 nm to 2.5 mm. It is used in food product development and quality control to quantitatively assess the size of particles related to food texture.
Importance of Particle Evaluation in Foods
- Quantification of Food Texture
-
In foods that contain solid particles:
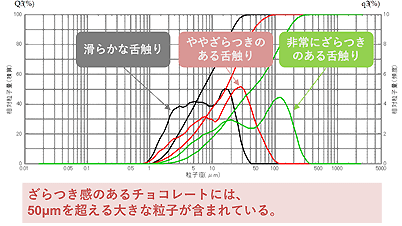
- Coarse particles, with shapes that are nonuniform and irregular
⇒ Rough texture - Fine particles, with shapes that are uniform or spherical
⇒ Smooth texture
- Coarse particles, with shapes that are nonuniform and irregular
-
In liquid foods:
- High concentration ⇒ Rich and smooth
- Low concentration ⇒ Refreshing and light
- Evaluation of Food Quality
-
- Stability evaluation of emulsions and so on.
(checking for aggregates and contaminants) - Stabilization of quality through quantitative control
- Stability evaluation of emulsions and so on.
Particle Size Diffraction Evaluative Method
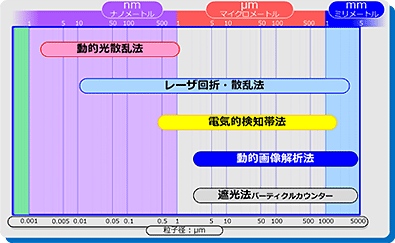
- Laser Diffraction and Scattering Method
-
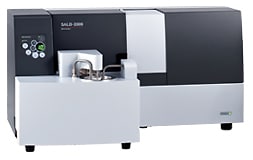
- Laser Diffraction Particle Size Analyzer
SALD-2300
- Dynamic Image Analysis Method
-
- Dynamic Particle Image Analysis System
iSpect DIA-10
Laser Diffraction and Scattering Method
Information Gained from the Laser Diffraction and Scattering Method
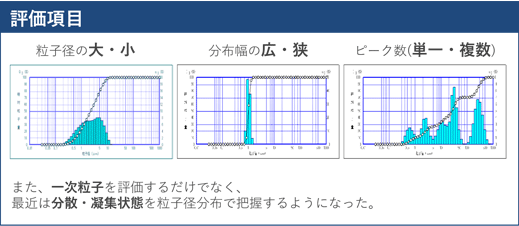
Particle size distribution:
What size of particles does the sample contain, and in what ratio?
- Evaluation of the Feeling on the Tongue: Chocolate
High Sensitivity and High Concentration
Normally, when measuring particle size distributions, to reliably catch distributions that change as a function of particle concentration, the particle concentration of the sample is diluted to match the conditions of the measuring instrument. In some cases, the sample was concentrated using centrifuge separation.
In other cases, when agglutination occurs, the sample is diluted. To measure the particle size distribution under optimal conditions, it is necessary to measure the particle concentration as-is, without dilution or concentration. The SALD-2300 can handle a wide range of particle concentrations from a low 0.1 ppm to a high 20 %, enabling the sample to be evaluated under conditions as close as possible to the actual state of the product itself.
- Evaluation of Agglutination
in Liquid Products under High Concentration Conditions 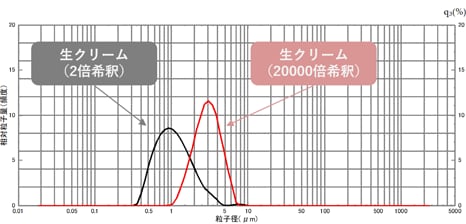
-
In addition to milk fat content, the distribution of fat globules is also thought to impact the taste (weight and lightness). Additionally, when emulsion-based samples are diluted, the particle size also sometimes changes. Accordingly, performing the measurements at a concentration as close as possible to the product itself is preferable.
- Measurement of Tea Particles
in Bottled Tea Products 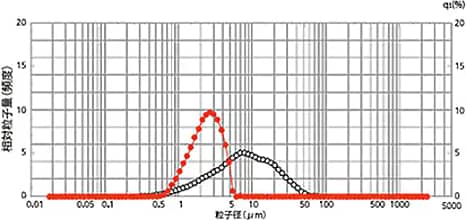
-
These are the results of measuring two types of tea in PET bottles as-is (original state). The low-concentration sample is measured as-is (original state) without performing any difficult concentration operations. Measuring low-concentration samples as-is removes the effects of dispersion or agglutination caused by adjusting the concentrations.
Dynamic Image Analysis Method
What is Learned from the Dynamic Image Analysis Method
In this method, images of flowing particles are scanned, and the size and shape of each particle are measured using image analysis. The shapes of the particles, which cannot be obtained from the laser diffraction and scattering method, as well as aggregates and trace quantity particles, can be measured using this method.
- The laser diffraction and scattering method can quickly measure a wide range of particle size distributions.
- The dynamic image analysis method can measure particle shapes, identify aggregates, and measure particle concentration.
Examples of measurement using the laser diffraction
and the scattering method
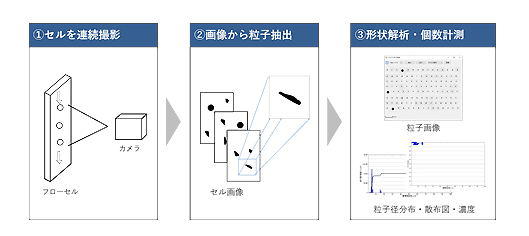
Principles of the dynamic image analysis measurement method
Enables particle size, particle shape, and concentration measurements
Application: Evaluation of the Feeling on the Tongue of Green Tea
It is possible to measure the concentration and particle size distribution of matcha particles added to bottled tea products and detect any trace amounts of contaminants.
These are some examples of measurements taken on two types of green tea beverages.
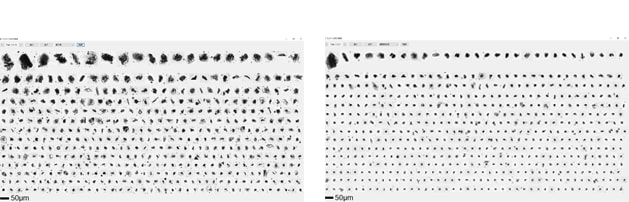
Figure. Measurement Results for Green Tea Beverages
(1) Part of a Particle Image
Left: Green Tea A; Right: Green Tea B
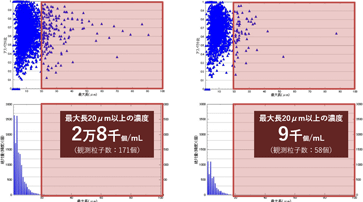
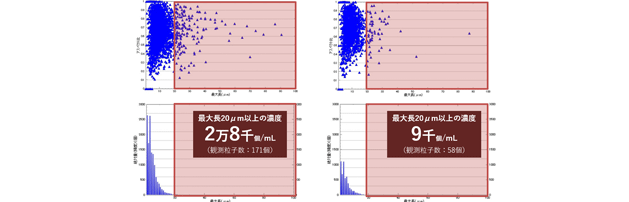
Figure. Measurement Results for Green Tea Beverages
(2) Scatter Plot and Particle Size Distribution
Left: Green Tea A; Right: Green Tea B
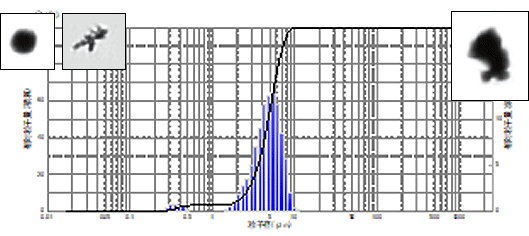
Application: Evaluation of the Budding of Bread Yeast
The ratio of yeast cells in different states can be checked by obtaining information on the shape of the yeast.
This shows an example of the measurement of commercially available baker’s yeast.
From the particle size distribution, it is clear that the peak is near 5 μm. Also, it is evident from the scatter plot of area-equivalent diameters and aspect ratio that the sample is divided into multiple groups.
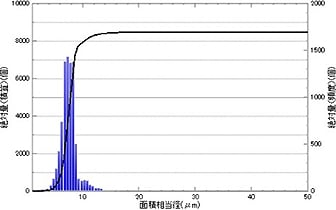
Figure. Particle Size Distribution
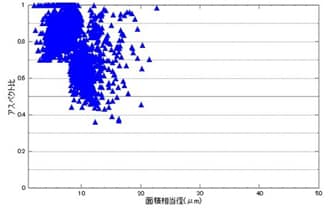
Figure. Scatter Plot
Typical particle images for each region are shown for when the scatter plot is partitioned as shown in the figure below. The larger the particle size, the more yeast cells are connected.
In addition, particles with an aspect ratio close to 1 are either single yeast cells or clumped particles. Smaller values indicate a group of linearly shaped particles.
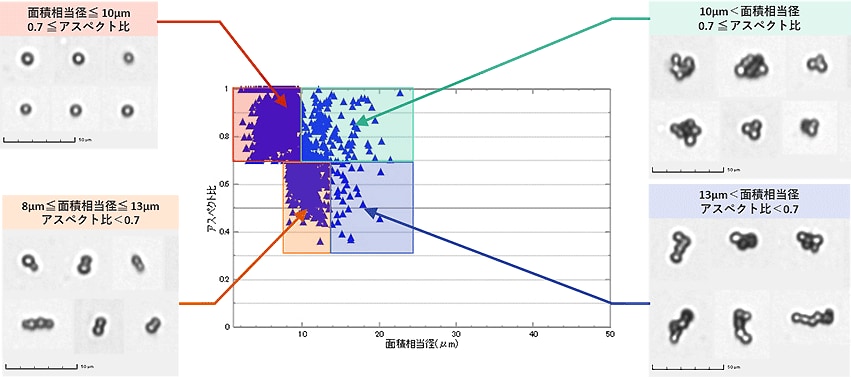
Figure. Typical Particle Images for Each Region
Ratios can be calculated from the number of particles in the respective regions.
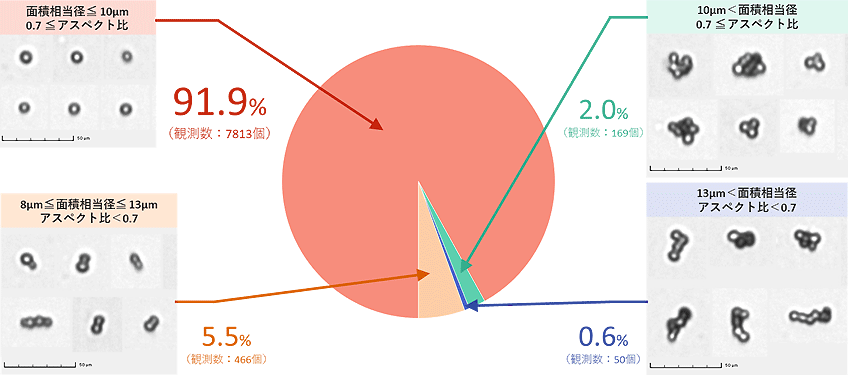
Figure. Particle Ratios for Each Region
Related Information
-
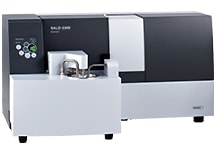
- SALD-2300 Laser Diffraction-type Particle Size Analyzer
- Measurement Range: 17 nm to 2500 μm
This analyzer supports a variety of measurement targets and objectives, including wet measurements, dry measurements, and the measurement of high-concentration samples. - Product Information
-
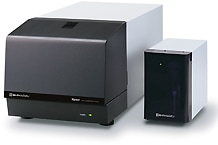
- iSpect DIA-10 Dynamic Particle Image Analysis System
- This single system can perform particle image analysis, particle shape analysis, particle size distribution measurements, contaminant detection, and number concentration measurements, normally measured with dedicated devices such as particle distribution analyzers and microscopes.
- Product Information
Distribution of Voids and Thickness within Food
Non-Destructive Testing System: X-ray CT System
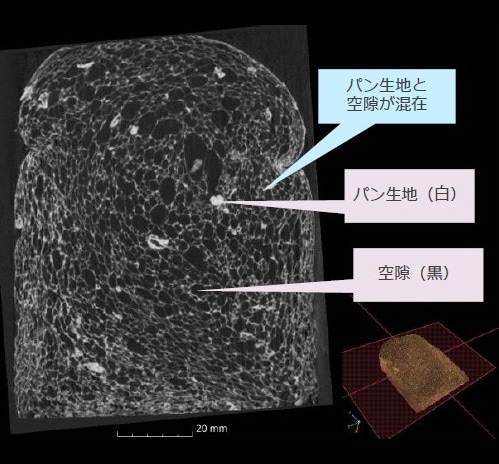
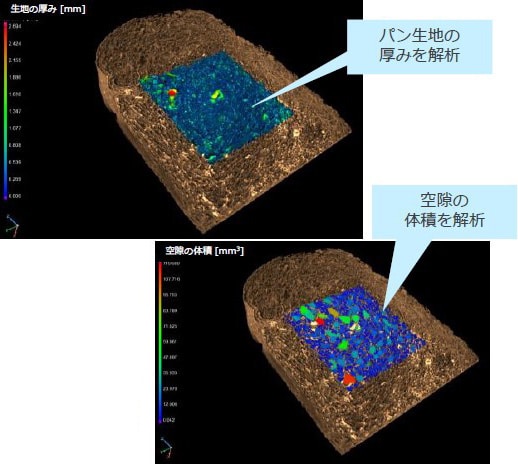
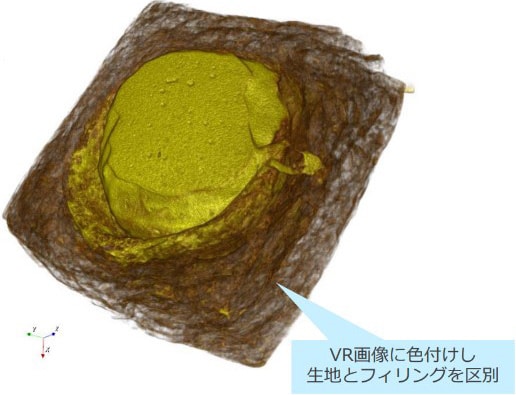
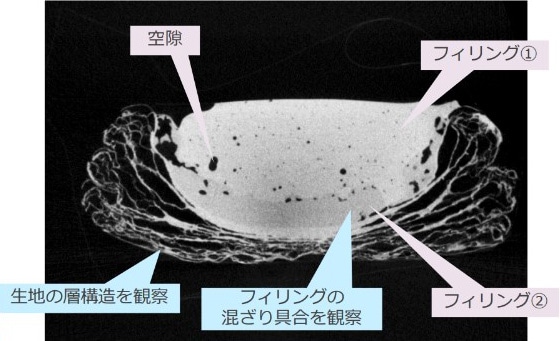
When evaluating food textures, a deeper analysis can be performed by understanding their internal structure rather than just using sensory evaluations, texture analyzers and fluid measurement instruments to evaluate physical properties. X-ray CT systems are useful for observing the internal structure of foods such as breads, which have a complicated porous structure, and foods packed with fillings in which multiple substances are blended. This is because such systems can visualize the internal 3D structure of the object without damaging it.
The distribution of voids and thicknesses within food can be visualized in a 3D display image, and their respective sizes can be calculated.
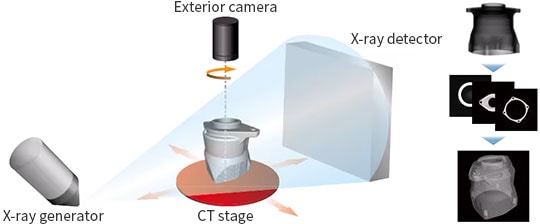
System Configuration and
Operating Principle
The inspection target (sample) is placed between the X-ray generator and detector, as shown in the figure. Then, the sample is rotated 360 degrees to collect X-ray fluoroscopic data from various angles in order to calculate cross-sectional images.
- High Resolution and Compatible with a Wide Range of Samples
-
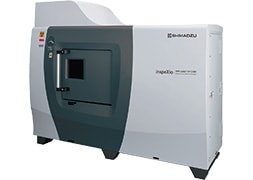
Microfocus X-ray CT System
inspeXio SMX-225CT FPD HR Plus
- Simple to use and compact
-
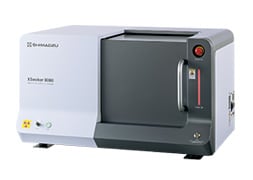
Table-top Type X-ray CT System
XSeeker 8000
Measurement Example: Bread
*VGSTUDIO MAX フォームパウダー解析 使用
Measurement Example: Danish Pastry
Related Information
-
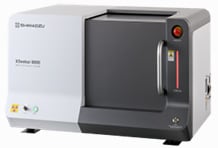
- XSeeker 8000 Table-top Type X-ray CT System
- The XSeeker 8000 is a table-top type X-ray CT system. It is equipped with a high-output X-ray generator and a high-resolution flat panel detector. Despite being a compact, table-top type CT system, it has a high 160 kV X-ray output and can clearly observe resin molded items, as well as aluminum, die case parts and other metal parts.
In addition, the newly developed XSeeker control software achieves high operability and record-breaking throughput.
With its clear image quality and high throughput, the system can be used in various applications, from detailed observations for product development and quality evaluations to inspections at machining worksites. - Product Information
-
- inspeXio SMX-225CT FPD HR Plus Microfocus X-ray CT System
- The inspeXio SMX-225CT FPD HR Plus is a high performance microfocus X-ray CT system equipped with a proprietary microfocus X-ray generator and a large high-resolution flat panel detector.
With its large detection area, input resolution equivalent to up to 14 million pixels, and a high output microfocus X-ray generator that has been further improved, the system challenges the conventional notion that high output instruments cannot obtain contrast when scanning soft materials since it can provide a wide field-of-view, high resolution, and high contrast cross-sectional images.
In addition, HPCinspeXio’s ultra-fast processing system achieves even higher speeds needed to match the detector's improved resolution.
This single instrument supports research, development, and inspections of all types of samples, from advanced composite materials (GFRP and CFRTP) to large aluminum die-cast products. - Product Information