STM Observation of Ni, Co and Pt Surface Morphology Changes due to CO Blowing (1)
Introduction
Metal reacts with carbon monoxide (CO) to generate carbonyl complex and there is a change in the surface morphology. This behavior is used in engineering and chemical fields, such as catalytic chemistry.
Regarding the way in which the surface of metal changes when it comes in contact with a very small amount of CO gas, there are cases where materials with simple structures, such as those consisting of single crystals, have been studied at the atomic level using ultrahigh-vacuum STMs.(1)(2)
Here, we present examples in which the macro-level changes in surface morphology that occur when thin films of the polycrystalline metals nickel (Ni), cobalt (Co), and platinum (Pt) come in contact with CO gas are observed using an STM in a gas atmosphere (Shimadzu WET-901 Environment-controlled STM). This is the first time for an Environment-controlled STM to be successfully used to observe changes in the surface morphology while heating the specimen and blowing gas onto it, using a specimen and atmosphere that are so close to the actual reaction system.
Gas Blowing and Specimen Heating System
Fig. 1 shows the system for blowing gas into the environment-controlled chamber and for heating the specimen.
The chamber can be evacuated using a turbomolecular pump to attain a vacuum level of less than 1.0 x 10⁻⁵ Torr. In this vacuum, it is possible to blow a small volume of gas onto the specimen surface at a fixed flow rate. Also, the heating holder makes it possible to increase the specimen temperature to approx. 300ºC while blowing gas. In this way, the reaction between the specimen surface and the gas can be stimulated.
By blowing H2 gas onto the specimen surface in a vacuum, oxides at the surface can be reduced and clean surface can be obtained. CO gas is blown onto this surface and the effect is observed with an STM.
With the Shimadzu WET-901 Environment-controlled STM, because an STM unit is installed inside the environment-controlled chamber, the changes that occur at the specimen surface while blowing gas can be observed in real time.
Fig.1 Gas blowing and specimen heating system
Ni Surface Cleaning
First, in order to remove the oxygen at the nickel surface, H2 gas is blown onto it in a vacuum. Fig. 2 shows the image obtained by STM observation before H2 gas was blown onto the specimen. Fig. 3 shows the image obtained with the same field of view after H2 gas was blown onto the specimen. In the latter case, a stable image was obtained and the island-shaped particle clusters can be seen clearly. This is probably because the metal surface was exposed when the following reductive reaction took place:
NiO + H2 → Ni (metal) + H2O↑
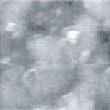
Fig.2 Ni surface before H2 blowing
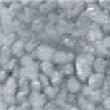
Fig.3 Ni surface after H2 blowing
Real Time Observation of Ni Surface Morphology Changes due to CO Blowing
Fig. 4 shows the image obtained by STM observation of the nickel surface after reduction processing was performed using H2 gas and before CO gas was blown onto it. Fig. 5 to Fig. 8 show sequential images obtained for the same specimen surface with the same field of view when CO gas was blown onto the specimen at a pressure of 4.0 x 10⁻⁵ Torr in the chamber. Fig. 9 shows the image obtained with the same field of view after blowing of CO gas was stopped.
In Fig. 5, particle clusters with diameters of approx. 20 to 30 nm can be seen. In Fig. 6, a cluster with a diameter of approx. 100 nm can be seen. In Fig. 8, this cluster starts to disappear and in Fig. 9, which was obtained after the blowing of CO gas was stopped, this cluster has disappeared completely. The surface morphology at this stage has returned to the state observed in Fig. 5, which was obtained immediately after the blowing of CO gas was started and, taking drift to the right into consideration, there is almost a one-to-one correspondence between the particle clusters.
The large cluster probably consisted of CO that was adsorbed by the nickel surface. When blowing was stopped, it became detached from the surface.
Fig. 10 to Fig. 12 show sequential images obtained with the same field of view when CO gas was blown onto the specimen with higher flow rates (at a pressure of 1.0 x 10⁻⁴ Torr in the chamber). Fig. 13 and 14 show the images obtained after blowing was stopped.
In Fig. 10, a large cluster can be seen at the same place as when CO blowing was first performed. In Fig. 11 and 12, this cluster gradually disappears while, at the same time, a gap is formed. In Fig. 13 and 14, which were obtained after CO blowing was stopped, unlike the first time CO blowing was performed, the surface morphology is significantly different from that before blowing, and the overall impression is that the surface has been depleted.
One possible explanation for this change in surface morphology is as follows. It is possible that, when the blowing of CO gas with relatively high flow rates was stopped, nickel carbonyl complex was generated, it moved away and became detached from the nickel surface, and as a result the surface was depleted. In this scenario, nickel carbonyl complex is generated by the following reaction:
Ni(metal) + nCO → Ni(CO)n↑
(Normally, n = 4.)
Also, through repetition of the same experiment, it was discovered that, even in nickel surfaces on which the particle clusters are evenly spread, there are parts that adsorb CO readily and parts that do not.
The specimens used in this experiment were provided by the National Institute of Materials and Chemical Research.
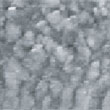
Fig.4 (□185.6nm) Ni surface before CO blowing
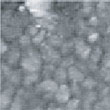
Fig.5 (□185.6nm) Ni surface during CO blowing
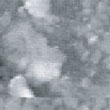
Fig.6 (□185.6nm) Ni surface during CO blowing
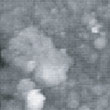
Fig.7 (□185.6nm) Ni surface during CO blowing
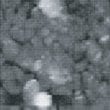
Fig.8 (□185.6nm) Ni surface during CO blowing
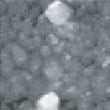
Fig.9 (□185.6nm) Ni surface after CO blowing
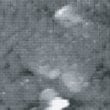
Fig.10 (□185.6nm) Ni surface during CO blowing
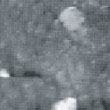
Fig.11 (□185.6nm) Ni surface during CO blowing
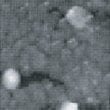
Fig.12 (□185.6nm) Ni surface during CO blowing
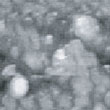
Fig.13 (□185.6nm) Ni surface after CO blowing
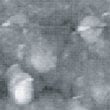
Fig.14 (□185.6nm) Ni surface after CO blowing
References
(1) C.M.Vitus,et al,J.Phys.Chem,Vol.95,20,7559-7563,1991
(2) J.Yoshinobu and M.Kawai,J.Electron Spectroscopy,64,207-216,1993