Evaluation of the Local Elastic Modulus of
Polymeric Materials Using SPM
Polymeric materials are gaining increasingly high functionalities, calling for technologies which enable detailed evaluation of their elastic modulus. However, methods for locally and quantitatively measuring the elastic modulus of relatively soft materials (having an elastic modulus of a couple hundred kPa to 1 GPa) were insufficient. A scanning probe microscope (SPM) has a resolution in the nanoscale and is capable of detecting minute forces in the order of nN and below. It is therefore gaining attention as a means for measuring the local physical properties of polymeric materials.
In this article, we introduce evaluations of the local elastic modulus of polymeric materials using SPM.
Calculation Method of Elastic Modulus
The SPM is a microscope for observing the three-dimensional shape and the local physical properties of a sample at a high magnification rate by scanning the sample surface with a minute probe (cantilever). Fig. 1 shows the instrument. In this research, we employed the Nano 3D Mapping Nanophysics Evaluation System for evaluating the elastic modulus.
Nano 3D Mapping calculates the elastic modulus by applying a theoretical model to the force curve. For polymeric materials, the JKR theory is suitable for the theoretic model. Fig. 2 shows Force Curve of a Soft Sample. The JKR theory utilizes two points on the force curve from the release process: the balance point and the maximum adhesion point. The balance point is where the cantilever deflection is "0". The maximum adhesion point is where the cantilever deflection is the highest in the dipping direction due to adhesion to the sample.
The sample deformation and the force exerted on the cantilever at these two points are determined and applied to the theoretical formula. Sample deformation is calculated by subtracting the cantilever deflection at the balance point and the maximum adhesion point from the cantilever deflection obtained when the sample is hard. The force exerted on the cantilever is calculated by multiplying the cantilever deflection by the spring constant of the cantilever. Mapping of the elastic modulus is also possible by acquiring force curves at a given number of points within a certain range and calculating the elastic modulus at each point. In addition, the adhesion force, which is the force exerted on the cantilever at the maximum adhesion point, can be mapped simultaneously.
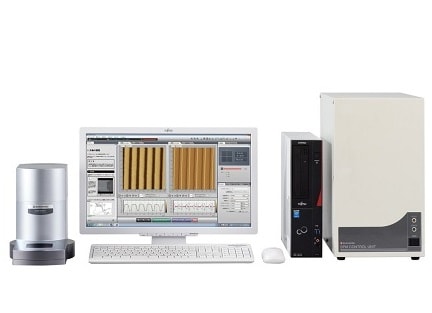
Fig. 1 SPM-9700HT Scanning Probe Microscope
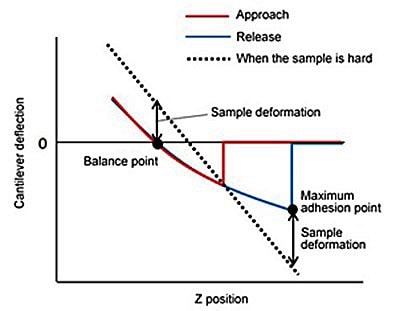
Fig. 2 Force Curve of a Soft Sample
Measurement of Elastic Modulus
Force curves were acquired at a single point each from samples of nitrile rubber, low-density polyethylene, and high-density polyethylene. Fig. 3 shows Force Curves and Calculated Elastic Modulus.
The cantilever was pressed onto each sample to a depth of about 5 nm and the maximum force that the cantilever exerted on the sample was 6 nN (with high-density polyethylene). This shows that extremely minute and extremely low-load pressing is achieved. The instrument is therefore suitable for evaluating the elastic modulus of thin and soft samples. The elastic modulus calculated by applying the JKR theory was 50 MPa, 260 MPa, and 1.3 GPa respectively for each sample. These values show a favorable match with the general elastic modulus of each material.
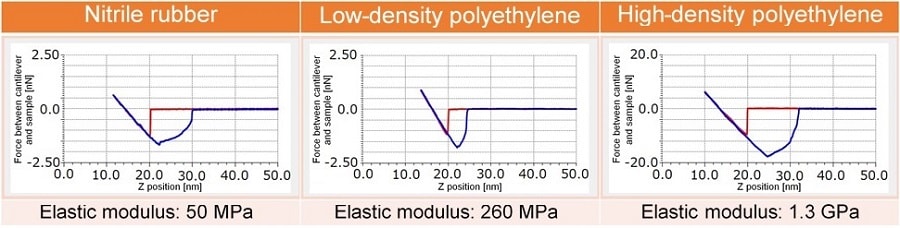
Fig. 3 Force Curves and Calculated Elastic Modulus
Mapping of Elastic Modulus and Adhesion Force
Curable liquid rubber was used as a sample for mapping. Fig. 4 shows the results. Data was acquired at 128 x 128 points within a scan range of 5 μm x 5 μm. The scanning area is the same for the (a) topography image, (b) elastic modulus image, and (c) adhesion force image.
By extracting data from the three different points 1 to 3 on image (b), we can see that the force curve shape differs at each point and that there is a difference of up to 600 times in the elastic modulus among the three points. We can also see that at points 2 and 3 where the elastic modulus is large, the adhesion force tends to be small. Nano 3D Mapping therefore enables simultaneous visualization of the local elastic modulus and adhesion force distribution on polymeric materials together with the topography of the material surface.
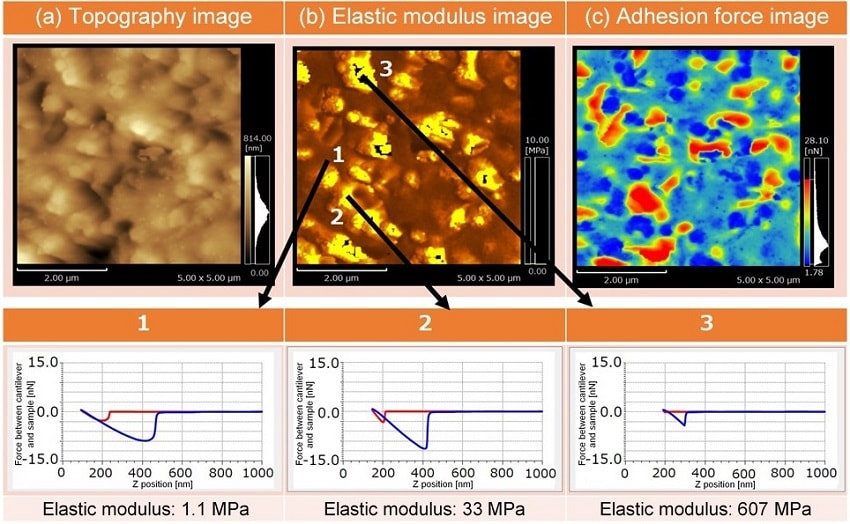
Fig. 4 Mapping of Elastic Modulus and Adhesion Force