Absorbance Detection: Ultraviolet Detectors & Photo Diode Array Detectors
Absorbance detection is the most common detection method in HPLC analysis.
Light is a type of electromagnetic wave, and electromagnetic waves are given different names depending on their wavelengths. Fig.1 shows the types of electromagnetic waves and their corresponding wavelengths.
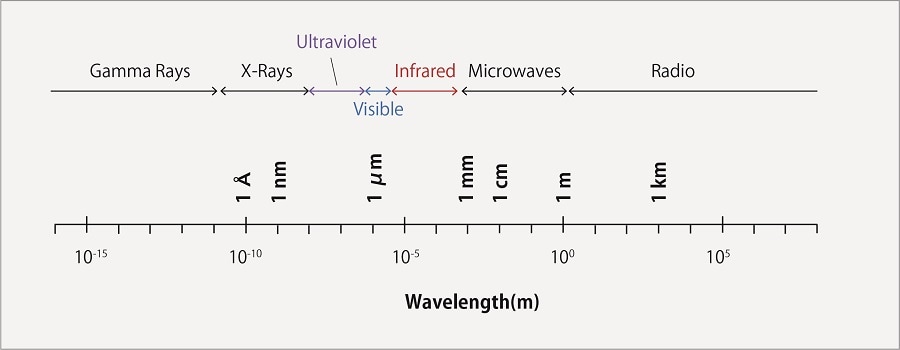
Fig.1 The Electromagnetic Spetrum
When a substance is irradiated with light, it absorbs light of a specific wavelength, and the energy of electrons change from their ground state (lowest state) to an excited state (high energy state). The wavelength of light absorbed depends on the structure of the substance. Light in the ultraviolet to visible range is used for absorbance detection.
Fig.2 shows the principle of absorbance detection in HPLC analysis. The absorbance is measured by monitoring the rate of decrease in the amount of light that passes through the cell when irradiating the solution in the flow cell with light of a particular wavelength. The absorbance is proportional to the concentration of the target substance. This can be defined as Lambert-Beer’s law.
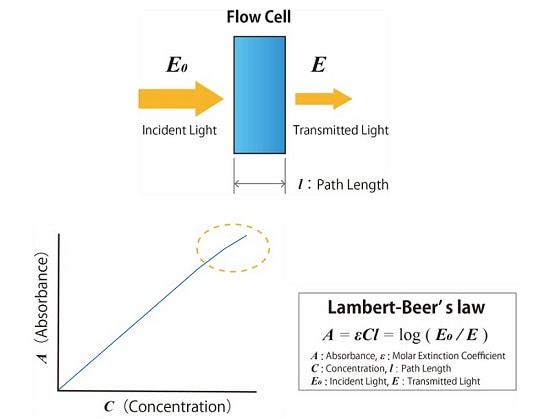
Fig.2 Principle of Absorbance Detection in HPLC Analysis (Above : Measurement of Absorbance, Below :Lambert-Beer’s Law)
The concentration of the component can be calculated by measuring the change in absorbance of the mobile phase passing through the flow cell of the detector. According to Lambert-Beer‘s law, the absorbance is proportional to the component concentration, but in practice, too high a concentration prevents the detector from obtaining an accurate measurement, as shown in Fig.2 . Therefore, it is necessary to quantify within a concentration range that guarantees a linear proportion with the absorbance rate, otherwise known as the dynamic range.
Fig. 3 shows a schematic diagram of an ultraviolet detector (UV). A deuterium (D2) lamp is used as an ultraviolet light source for the UV detector. The light emitted from the lamp is separated into a light beam of a certain wavelength with a diffraction grating, and then passes through the flow cell. The light that passes through the flow cell enters the photodetector (photodiode) and is converted into an electrical signal corresponding to the intensity of the light, which is processed as absorbance. A UV-visible detector with a D2 lamp and a tungsten lamp is suitable for monitoring not only ultraviolet but also visible light.
Fig. 4 shows a schematic diagram of a photodiode array detector (PDA *). Light emitted from a lamp installed in the PDA detector passes through the flow cell and then separated with a diffraction grating. When the separated light beam is received by a photodiode, which is a sequence of 1,024 photodetectors, only the wavelengths in the specified range are converted into electrical signals and processed as absorbance data. *In some cases, this is called a diode array detector (DAD).
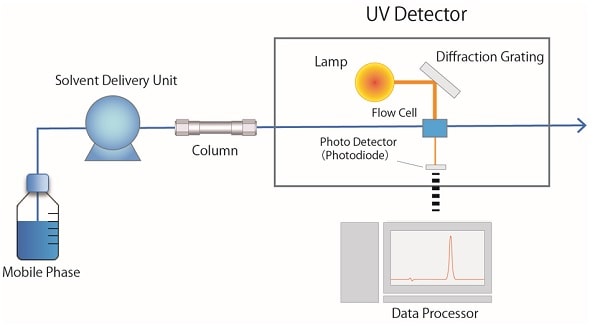
Fig.3 Schematic Diagram of a UV detector
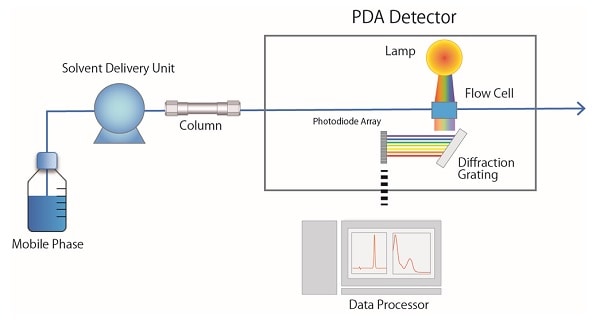
Fig.4 Schematic Diagram of a PDA detector
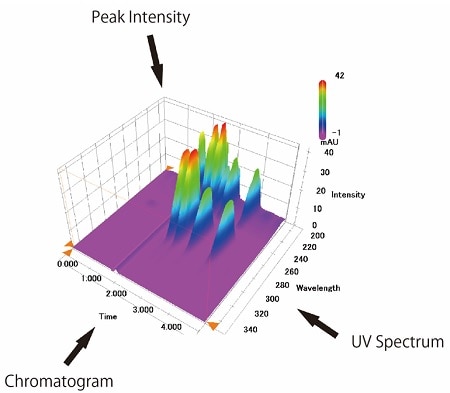
Fig.5 Data Obtained with a PDA Detector
Using a PDA detector allows you to measure a continuous UV spectrum, resulting in a multi-wavelength chromatogram. The detector provides not only a chromatogram that refers to time on the X axis and absorbance on the Y axis, as obtained with the UV detector, but also three-dimensional data having a wavelength axis on the Z axis.(Fig.5)
Fig. 6 shows an example of analysis of the ultraviolet absorbents, which are active ingredients in cosmetics, using a PDA detector. As shown in the left figure of Fig. 6, analysis using a PDA detector can obtain multi-wavelength chromatograms at one time. The right figure shows a UV spectra at the top of each compound peak.
The difference in the maximum absorption wavelength of the UV spectrum of each component enables simultaneous analysis at different wavelengths. Identification using a UV detector compares only the retention times of the target compound in standard and unknown samples, while PDA detectors compare UV spectra in addition to the retention time.
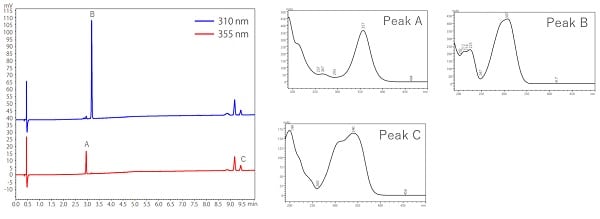
Fig.6 Analysis of UV Absorbents in Cosmetics by PDA Detector
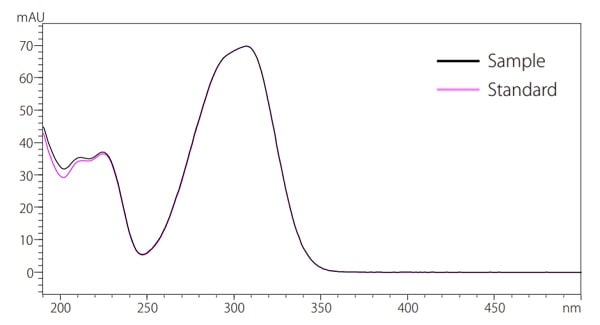
Fig.7 Identification based on UV spectrum
Fig. 7 shows an overlay of both the sample UV spectra and the standard UV spectra for peak B when detected at 310 nm. The UV spectra of the compounds detected in the cosmetics are suggested to be the same compounds as the standard substance because the two UV spectra coincide. The use of PDA detectors can obtain a UV spectrum, allowing for more reliable qualitative analysis.
Supporting Information
In addition, some products allow software processing of data obtained using a PDA detector to separate unseparated peaks and expand dynamic range.