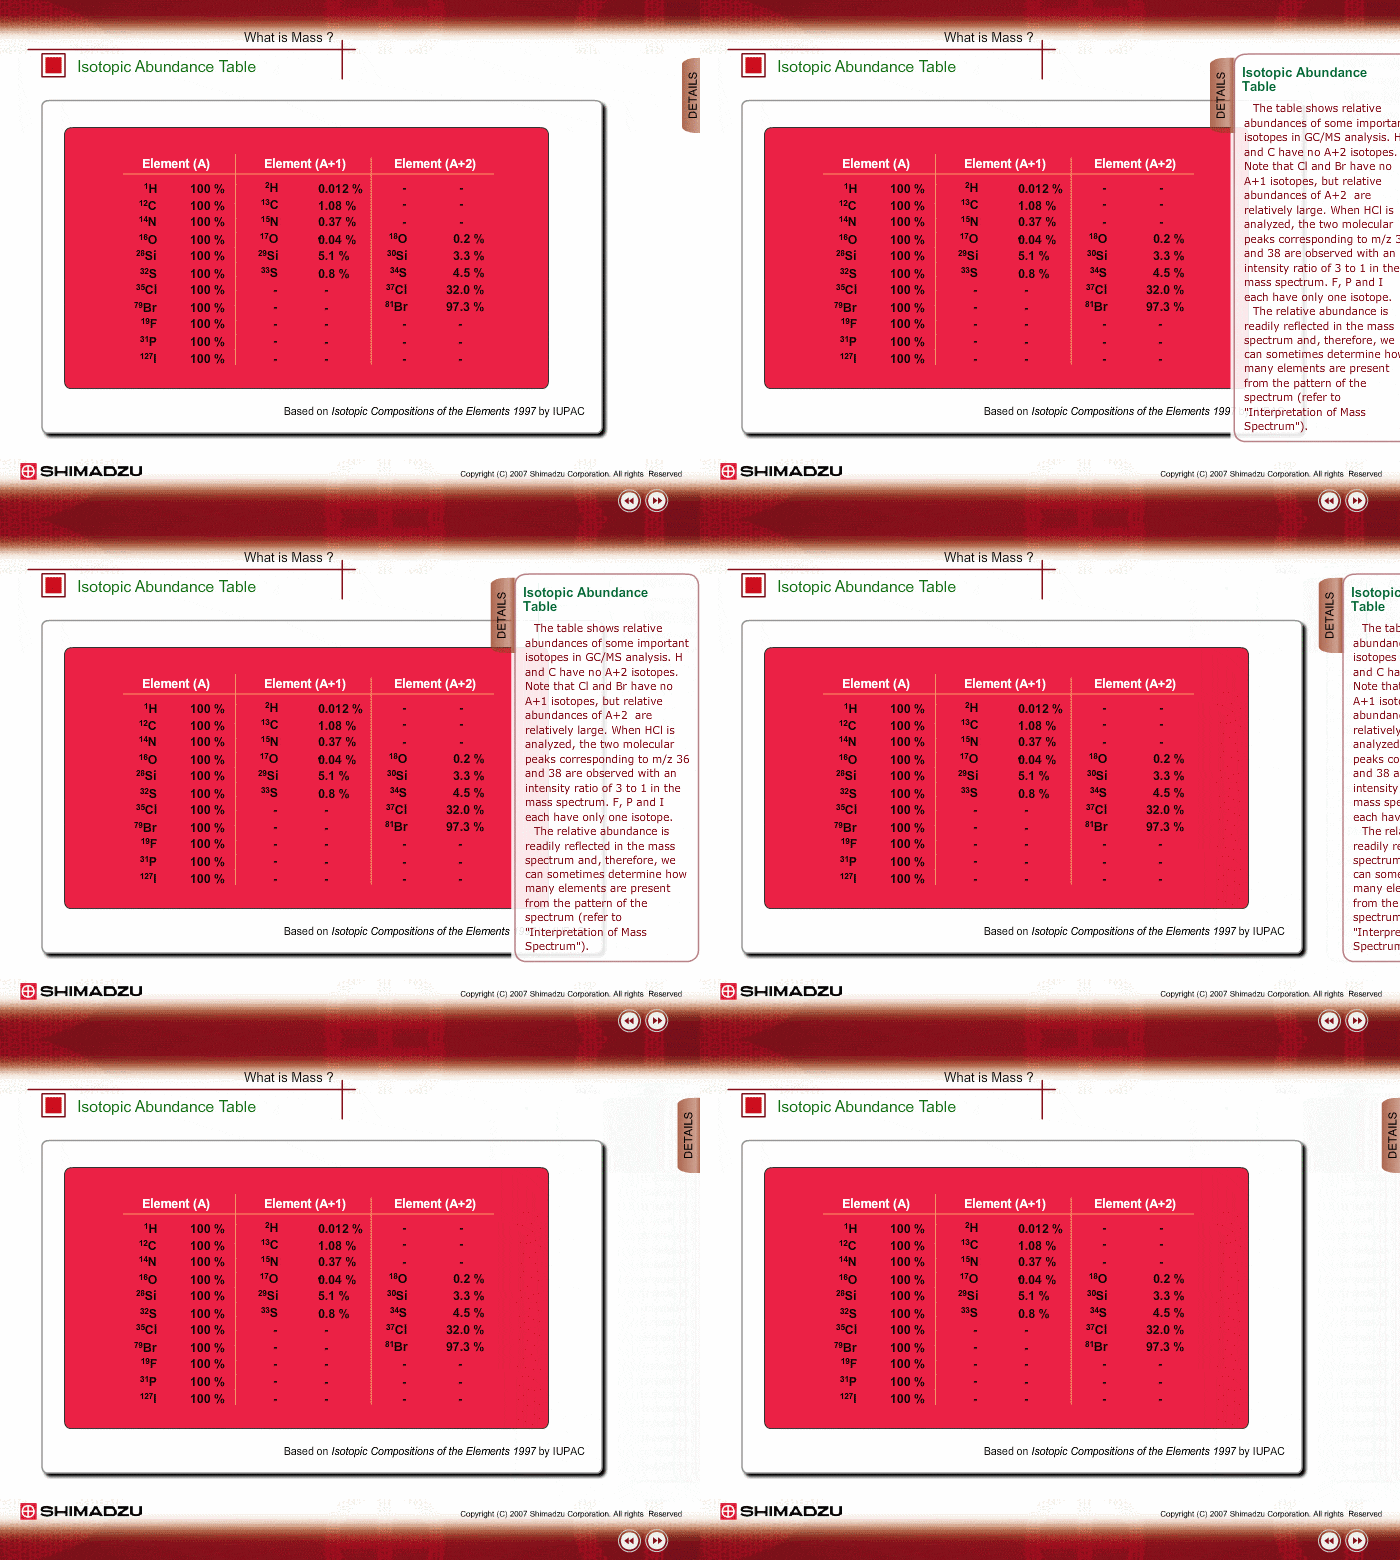
Isotope Abundance Table
The table shows relative abundances of some important isotopes in GC/MS analysis. H and C have no A+2 isotopes. Note that Cl and Br have no A+1 isotopes, but relative abundances of A+2 are relatively large. When HCl is analyzed, the two molecular peaks corresponding to m/z 36 and 38 are observed with a strength ratio of 3 to 1 in a mass spectrum. F, P and I have no isotopes. The relative abundance is readily reflected in the mass spectrum and, therefore, we can sometimes determine how many elements are present from the pattern of the spectrum (refer to "Interpretation of Mass Spectrum").

Next >> Molecular Weight


