KBr Pellet Method
- Samples That Cannot be Analyzed by KBr Pellet Method (Hydrochlorides) -
Many people know that since the Fourteenth Edition of the Japanese Pharmacopoeia, the general test method changed from the potassium bromide (KBr) pellet method to a choice between the KBr pellet method or the potassium chloride (KCl) pellet method. But it is not well known why the prescribed test method was changed or which test method should be applied to what sample. This Application News compares the KBr pellet method and the KCl pellet method on hydrochlorides, which are typical samples that should not be analyzed using the KBr pellet method.
■ Pelletizer (miniature manual press)
Fig. 1 shows the MHP-1 pelletizer used to prepare the test samples. The accessories supplied make it extremely easy to form 4-mm dia. pellets (previously 3-mm dia.). Unlike conventional pelletizers, it requires no vacuum pump. It is a manual press that can rapidly form the pellets.
In accordance with the Japanese Pharmacopoeia, the wavenumber range was set to 4000 to 400cm-1 for the measurements. Table 1 shows the measurement conditions in detail.
Table 1 Measurement Conditions
- Resolution : 4 cm-1
- Accumulation : 45
- Detector : DLATGS
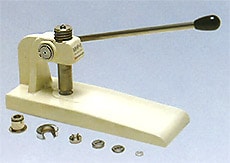
Fig 1 Appearance of MHP-1 Pelletizer
■ Measurement of L-Cysteine Hydrochloride
Fig. 2 shows the spectrum measured by the KCl pellet method (blue) and the spectrum measured by the KBr pellet method (red). Fig. 3 shows a magnified image of Fig. 2 in the range from 900 to 700 cm-1.
Fig. 3 shows that the KBr pellet method spectrum exhibits a peak at 800 cm-1 where no peak should exist. In addition, the peak position near 775 cm-1 is shifted somewhat toward the low-wavenumber end in the KBr pellet method spectrum. The difference between the two spectra results from ion exchange between chloride ions and bromide ions when a hydrochloride sample is diluted by KBr. While not shown here, the single-reflection ATR attachment can obtain a spectrum equivalent to the KCl pellet method, without pretreatment.
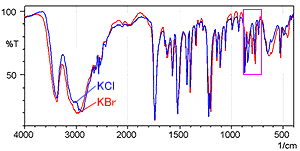
Fig. 2 Spectra of L-Cysteine Hydrochloride
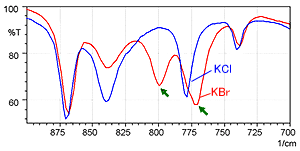
Fig. 3 Magnified View of Fig. 2
Fig. 4 shows a time series of spectra measured for L-cysteine hydrochloride using the KBr pellet method (with the same wavenumber range as Fig. 3). The blue line is the spectrum immediately after forming the pellet, the red line was measured after 2 minutes, and the green line was measured after 10 minutes.
Fig. 4 shows that the peak intensity near 800 cm-1 gradually increases, while the peak near 840 cm-1 decreases. In addition, it can be seen that the peak near 775 cm-1 gradually shifts toward the low-wavenumber end. This also indicates a gradual ion exchange when L-cysteine hydrochloride is analyzed using the KBr pellet method.
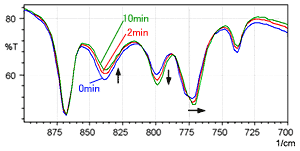
Fig. 4 Spectrum of L-Cysteine Hydrochloride (KBr Pellet Method)
■ Measurement of Diphenhydramine Hydrochloride
The Japanese Pharmacopoeia prescribes the KCl pellet method for the analysis of diphenhydramine hydrochloride, instead of the KBr pellet method. Here, we compare the differences between analysis by these two methods.
Fig. 5 shows the spectra of diphenhydramine hydrochloride measured using the KBr pellet method and the KCl pellet method. The red line is the KBr pellet method spectrum and the blue line is the KCl pellet method spectrum.
The shapes of the spectra are clearly different near 3000 cm-1. Other differences are also apparent in the low-wavenumber region. Fig. 6 shows an magnified image of the 1500 to 400 cm-1 wavelength range where differences are apparent.
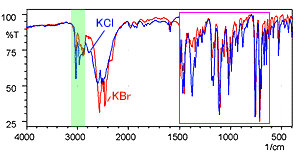
Fig. 5 Spectra of Diphenhydramine Hydrochloride
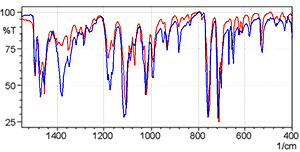
Fig. 6 Magnified View of Fig. 5
Observing the data for the single-reflection ATR measurement of diphenhydramine hydrochloride which means that the KBr pellet method spectrum is distorted due to ion exchange. However, the KCl pellet method obtains a spectrum similar to the single-reflection ATR method. Should ion exchange occur with the sample during the KCl pellet measurements, as the ions exchanged are the same chloride ions, it results in no change to the sample structure.
As shown above, as ion exchange occurs in some hydrochloride samples when analyzed using the KBr pellet method, the results of analysis by the KBr pellet method must be confirmed by some other analysis method.
- Samples Requiring Caution with the KBr Pellet Method -
Important Points Related to KBr Pellet Method Part 1 introduced hydrochlorides as typical samples that should not be analyzed using the KBr pellet method due to ion exchange. Part 2 introduces the analysis of L-arginine and citric acid, for which the spectra may deform when analyzed using the KBr pellet method.
■ Measurement of L-Arginine
Fig. 1 shows the spectrum of L-arginine measured by the KBr pellet method. Table 1 shows the measurement conditions.
Table 1 Measurement Conditions
- Resolution : 4 cm-1
- Accumulation : 45
- Detector : DLATGS
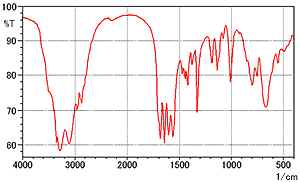
Fig. 1 Spectrum of L-Arginine (KBr Pellet Method)
Fig. 2A and 2B show the spectrum in Fig. 1 overlaid with the spectrum measured by the single-reflection ATR method (DuraSamplIR-II, diamond/KRS-5 prism), which requires no pretreatment. The single-reflection ATR method data is ATR-corrected and the intensities are matched for easy comparison. The red line is the spectrum from the KBr pellet method and the blue line is the single-reflection ATR spectrum.
Fig. 2B shows that the number of peaks is clearly different near 1500 to 1750 cm-1. Fig. 2A shows that the peak shapes are also different in other regions. Factors causing the differences in spectral shape due to the measurement method are thought to include moisture in the KBr powder and the pressure applied during pellet formation. These factors are investigated below.
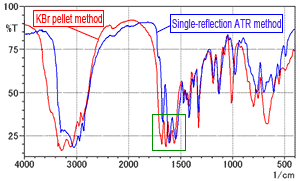
Fig. 2A Spectrum of L-Arginine (Comparison of KBr pellet method and single-reflection ATR method)
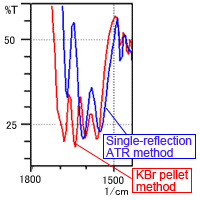
Fig. 2B Spectrum of L-Arginine (Magnified image near 1500 to 1800 cm-1)
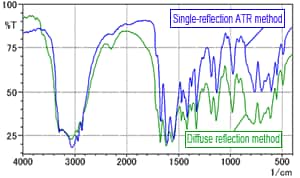
Fig. 3 Spectrum of L-Arginine (Comparison of diffuse reflection method and single-reflection ATR method)
(1) Assuming effects from moisture in KBr powder only
To investigate the effects of the moisture contained in the KBr powder, with no influence from the pressing process, L-arginine was measured using the diffuse reflection method. The diffuse reflectance method also involves mixing with KBr powder, but permits investigation into the effects of the moisture alone, without forming the powder into pellets. Fig. 3 shows the diffuse reflectance spectrum obtained overlaid on the single-reflection ATR spectrum. The green line is the diffuse reflectance spectrum and the blue line is the single-reflection ATR spectrum. Fig. 3 shows minor differences in peak intensity but no major differences between the spectra. Consequently, it is difficult to conclude that the moisture in the KBr powder has any effect.
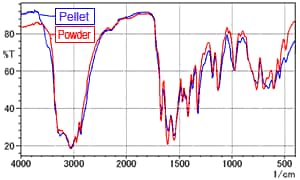
Fig. 4 ATR Spectrum of L-Arginine (Comparison of powder and pellet)
(2) Assuming effects from pelletization pressure only
To investigate the effects of the pressure applied during pelletization, the L-arginine was directly formed into pellets (without a mixing process with KBr powder) and measured using the single-reflection ATR method. Fig. 4 shows the spectrum for the powder (red line) overlaid with the spectrum for the pellet (blue line).
Fig. 4 shows no significant differences between the spectra. Consequently, it is difficult to conclude that the pelletization pressure has any effect.
From the results above, it is assumed that the effects during the measurement of L-arginine by the KBr pellet method are not due to the moisture in the KBr powder or the pelletization pressure alone, but rather to a combination of both. Therefore, to check the effects on the spectrum of the moisture in the pellets, we analyzed a pellet while drying it in a dryer.
Fig. 5 shows the changes in the spectrum while drying the pellet.
The red line is the spectrum immediately after forming the pellet. The blue, green, and black lines are the spectra measured after 1, 3, and 10 minutes' drying time, respectively. The insert is a magnified image from 1500 to 1800 cm-1.
Fig. 5 shows reduced absorption by the O-H group near 3500 cm-1 and a decrease in the number of peaks from four to three near 1500 to 1750 cm-1. The spectrum after 10 minutes' drying closely resembles the spectrum measured using single-reflection ATR method.
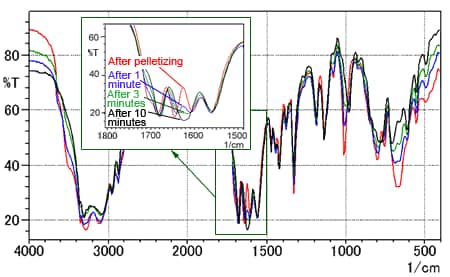
Fig. 5 Time Series of L-Arginine Spectra (KBr pellet method)
These results indicate that moisture contained in the KBr powder when the pellet is produced affects the spectral shape when L-arginine is measured by the KBr pellet method.
■ Measurement of Citric Acid
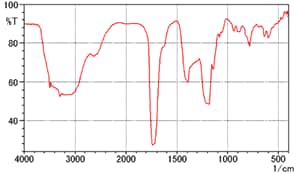
Fig. 6 Spectrum of Citric Acid (KBr pellet method)
Fig. 6 shows the spectrum of citric acid measured using the KBr pellet method. The peak shapes differ from the citric acid spectrum listed in the Supplement 1 of the Japanese Pharmacopoeia Fourteenth Edition, which is not shown here. (There are more peaks overall and the peak near 1700 cm-1 is divided in the Japanese Pharmacopoeia spectrum.) 1)
Fig. 7 shows the spectra measured for a pellet after drying it in a dryer. The red line is the spectrum immediately after forming the pellet. The blue and green lines are the spectra measured after 3 and 10 minutes' drying time, respectively.
Fig. 7 indicates a change in the peak shape near 1700 cm-1 after drying. After 10 minutes' drying the spectrum shape became the same as the spectrum listed in the Japanese Pharmacopoeia. (However, the actual time depends on the dryer power.) Therefore, take due care of the moisture content of the KBr powder when analyzing citric acid using the KBr pellet method.
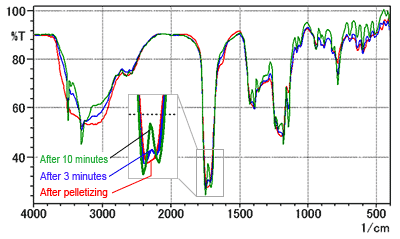
Fig. 7 Time Series of Citric Acid Spectra (KBr Pellet Method)