Resolution and Aperture
1. What Is Resolution?
Resolution is one of the measurement parameters involved in obtaining spectra with FTIR.
The resolution can be set to values such as 16 cm-1, 8 cm-1, 4 cm-1, or 2 cm-1. It indicates the degree of fineness of the data obtained by measurement (i.e., the minimum peak interval that can be distinguished). For example, if 4 cm-1 is selected, spectra will be obtained at intervals of approximately 2 cm-1. To obtain sharper spectra (i.e., spectra with a higher resolution), a value such as 2 cm-1 or 1 cm-1 is set.
In fact, although this works for gaseous samples, there are cases with solid and liquid samples where the resolution of the data obtained does not improve even if a higher resolution is set. This is because the molecules of the solid or liquid are influenced by other molecules around them, causing the actual peaks to broaden.
Also, if the resolution is increased, a smaller aperture is selected in the way described later, and the intensity of the light entering the detector is reduced, increasing the relative amount of noise in the spectra. Therefore, it is undesirable for the resolution to be increased more than necessary.
For this reason, the resolution is usually set to approximately 4 cm-1 for solid and liquid samples, and to approximately 1 cm-1 or 0.5 cm-1 for gaseous samples. On some occasions, a low resolution is set for gaseous samples if the purpose is quantification.
2. Comparing FTIR to a Camera
Although it is a rather crude analogy, I think that comparing the resolution setting for FTIR to the aperture and shutter speed settings for a camera can make it easier to understand.
Table 1 FTIR and Camera Settings
| FTIR | Camera |
| Infrared radiation source | Light from subject |
| Aperture (resolution) | Aperture |
| Number of integrations | Exposure time(shutter speed) |
| Gain setting(normally AUTO) Detector setting(TGS detector, MCT detector, etc.) |
ISO sensitivity of film |
The aperture of a camera is a mechanism by which the light that is received from the subject is focused at the aperture position, and the quantity of light is adjusted. Narrowing the aperture gives a sharper photograph, but because this also reduces the light intensity, the resulting photograph is darker.
In order to increase the brightness, the shutter speed is reduced, so that the cumulative amount of light reaching the film increases.
In FTIR, the clarity of the spectra (i.e., the sharpness of the peaks) obtained can be changed by selecting a different aperture.
With a camera, light from the subject is projected onto film. With FTIR, an infrared radiation source is incorporated inside the instrument, the sample is irradiated with infrared radiation, and the changes in light intensity are concentrated by a detector.
It is not easy to change the actual size of the radiation source, so it is changed artificially by focusing an image of the radiation source at the aperture position and then changing the size of the aperture.
3. What Is an Aperture?
The ideal form of radiation source is a point source. However, not only does such a source not exist in reality, a source of a certain size is used in order to ensure a sufficient level of light intensity at the surface of the infrared detector. As the source is not a point source, the light entering the interferometer does not consist solely of parallel light. The sample is also irradiated with grazing-incidence light, and this is ultimately received at the infrared detector, where it constitutes part of the measured signal.
This grazing-incidence light is handled in the same way as normal incident light, the long-wavelength component is incorporated in the obtained data, as a component with a wavelength longer than actual by an extent proportional to the angle of grazing incidence.
The size of this grazing-incidence component varies according to the size of the radiation source. Consequently, the aperture diameter should be selected so that the measurement resolution is not affected by the spread of peaks due to the grazing-incidence light.
In the FTIR instrument, if "AUTO" is set for the aperture, then the aperture is automatically set in accordance with the set resolution. The aperture diameter, A (cm), required at each resolution level can be calculated using the following formula.

Fig. 1 uses power spectra to show the differences in light intensity for different apertures.
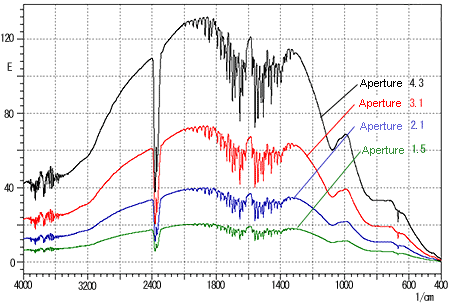
Fig. 1 Differences in Light Intensity for Different Apertures
In FTIR, a fast Fourier transform (FFT) is used to convert interferograms to power spectra so the numbers of data points for each resolution are all powers of two. (See Table 2.) As can be seen from the figure, the light intensity is roughly halved when the resolution level is doubled. The apparent level of noise increases by an amount corresponding to the decrease in light intensity; so, with a high-resolution measurement, it is necessary to set a sufficiently high number of integrations to obtain clear spectra.
4. Resolution and Number of Data Points
With general-purpose infrared spectrophotometers, resolution is usually selected in the range of 16 cm-1 to 0.5 cm-1. The following changes take place inside the instrument when the resolution is set:
The travel distance of the moving mirror (i.e., the optical path difference) is set in accordance with the set resolution.
The aperture is set in accordance with the set resolution.
With the Shimadzu IRPrestige-21, the following settings are used.
Table 2 Resolution and Parameter Settings
| Resolution | 16 | 8 | 4 | 2 | 1 | 0.5 |
| Optical Path Difference | 0.075 | 0.125 | 0.25 | 0.5 | 1 | 2 |
| Number of Data Points | 2048 | 4096 | 8192 | 16384 | 32768 | 65536 |
| Data Interval (See note 1.) | 7.72 | 3.86 | 1.93 | 0.96 | 0.48 | 0.24 |
| Aperture Diameter | open | open | open | 3.0 | 2.4 | 1.5 |
Note 1: The figures given are theoretical values. In practice, they are corrected in accordance with parameters associated with the selected aperture diameter.
With FTIR, data is usually sampled at the interference fringe position using a helium-neon (He-Ne) laser with an operation wavelength of 632.8 nm.
Converting this wavelength to a wavenumber gives 7,901 cm-1. Dividing this by half of the number of data points (because data also appears on the negative side with an FFT) gives the data interval.
If measurement is performed at a resolution of 4 cm-1, 8,192 data points are collected. As such, data is generated at the intervals of the following size:
7901 ÷ 8192/2 ≅ 1.93 cm-1
This is a theoretical value. In practice, the optical wavenumber is corrected by applying a correction value that is set in accordance with the selected aperture diameter. The travel distance of the moving mirror (i.e., half the optical path difference) is proportional to the number of sampling points.
The numbers of data points required resolution, however, are as shown in Table 2.
5. Points to Note for Actual Measurements
Fig. 2 shows spectra obtained for water vapor in air at different resolutions.
It can be seen that, as the resolution increases, the detail of the absorption peaks for the water vapor becomes clearer.
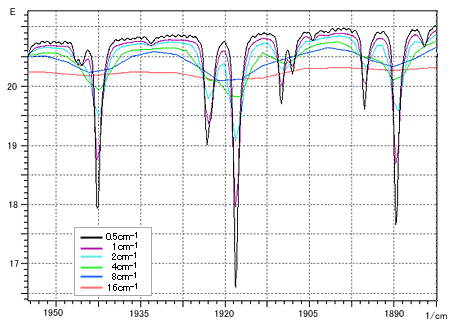
Fig. 2 Spectra of Water Vapor Obtained at Different Resolutions
The aperture is positioned at the image-formation position of the radiation source. The focusing position of the sample chamber is also set at the image-formation position of the radiation source.
For this reason, if there is something in the sample chamber, such as a sample holder, that limits the light intensity in the same way as the aperture, there may be discrepancies in the wavenumbers or the waveform may be disrupted.
For example, this problem might occur if background is measured without a sample holder, and then the sample is measured with a holder that greatly influences the diameter of the light beam. (See Fig. 3.)
This problem can be prevented by measuring background with a sample holder (but without a sample), or by setting the aperture diameter used in sample analysis to 1.5 or 2.4. (See Fig. 4.)
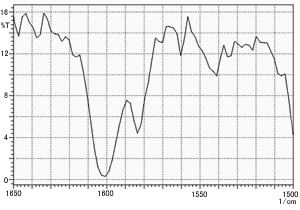
Fig. 3 Inaccurate Spectra Obtained by Measuring Background Without a Sample Holder
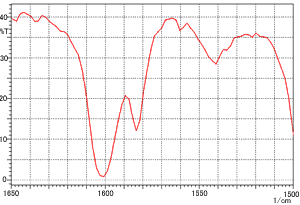
Fig. 4 Spectra Obtained Under the Same Conditions Used for Fig. 3 with an Aperture Diameter of 1.5