Foreign Matter Analysis by FTIR Handling Spectra of Foreign Matter
FTIR is convenient and effective for the analysis of foreign matter and other defect analysis and is widely used in many fields of application. FTIR encompasses many measurement methods and accessories, including infrared microscopy and singlereflection ATR. The selection of the appropriate measurement method and accessory for the aim and target of the analysis is extremely important to obtain a satisfactory spectrum. Therefore, FTIR TALK LETTER previously introduced information on accessories for infrared microscopy (Vol. 3 and 4) and measurement techniques (Vol. 5 and 6).
However, details about the information contained in the measured spectra and how to use it have not yet been presented. This article, "Foreign Matter Analysis by FTIR -Handling Spectra of Foreign Matter-", introduces the basics of reading the analysis results for foreign matter.
1. The Effects of Sampling
In many cases, foreign matter analysis by FTIR is conducted on discovered foreign matter after performing sampling. If only the foreign matter can be extracted during sampling, the subsequent analysis yields information (spectra) on the foreign matter only. However, if other substances are sampled together with the foreign matter, the other substances will have an effect on the analysis results. For example, when foreign matter is extracted from a powder or liquid, powder or liquid can adhere to the surface of the foreign matter or seep inside it, and any effects they cause must be identified.
The upper spectrum in Fig. 1 is the result of analyzing fibrous foreign matter discovered in food by single-reflection ATR (diamond prism). These results indicate that the major component of the fibrous foreign matter is cellulose based, but peaks unrelated to cellulose are apparent, such as near 1740 cm-1.
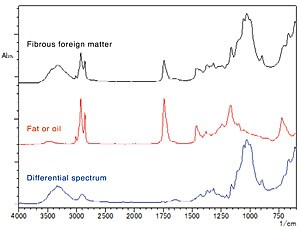
Fig. 1 Measurement Results on Fibrous Foreign Matter in Food Upper spectrum: Fibrous foreign matter; Middle spectrum: Fat or oil; Lower spectrum: Differential spectrum
The middle spectrum in Fig. 1 is the analysis results on the food in which the foreign matter was discovered, using the same analysis method. These measured results are the spectrum of a fatty acid ester (fat or oil), and this spectrum partially matches the spectrum for the foreign matter above.
The lower spectrum in Fig. 1 is the differential spectrum of the two above (fibrous foreign matter - fat/oil). Eliminating the fat or oil reveals the spectrum of cellulose.
As in this case, the analysis of sampled foreign matter can be affected by where it was discovered. In addition, as sampling can be conducted using adhesive tape, a paper or other filter, or by drying, it is possible for the adhesive or some of the filter to adhere to the foreign matter. These effects must be identified and eliminated before proceeding to the subsequent qualitative or analysis stage.
2. Checking Reproducibility
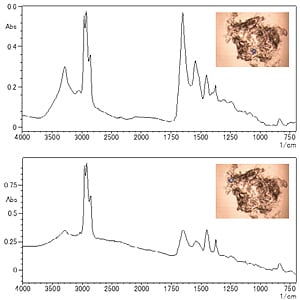
Fig. 2 Measured Spectra for Non-Uniform Foreign Matter Upper: Measurement position A; Lower: Measurement position B; Blue frames in photos show positions (20×20μm)
Multiple analyses are performed when repeated samplings are conducted for multiple foreign matter items or when the foreign matter sample is large enough to change the measurement position. Even if differences exist in the peak intensities or baseline in the measured results, the substances are considered to be the same (or uniform) if the shapes of the spectra match. It is possible to proceed directly to the subsequent qualitative or analysis stage.
However, differences in the shapes of the measured spectra indicate possible errors in the sample collection or other measurement operations, different samples, or non-uniform contaminants. The former case can be remedied by repeating the sampling and other operations. If multiple repetitions lead to identical results, the cause is likely to be one of the latter factors.
If the measured results differ according to the measurement position, the foreign matter is deemed to be non-uniform or not a single item. If the foreign matter comprises individual, separate substances, the measured spectra are also completely separate. In this case, it is possible to proceed directly to the subsequent qualitative or analysis stage.
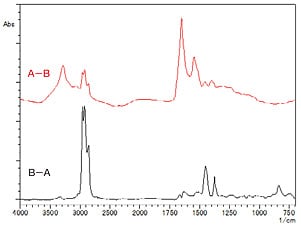
Fig. 3 Difference Spectra Upper: Measurement position A - Measurement position B (protein); Lower: Measurement position B - Measurement position A (polyisoprene)
However, a non-uniform mixture of multiple components results in similar spectra with different peak intensities. In this case, the differential spectrum is used to obtain more detailed information. Fig. 2 shows the spectrum for foreign matter rolled onto a diamond cell and measured using transmission infrared microscopy. It shows differences in peak intensity ratios near 2900 cm-1 and 1650 cm-1 due to the measurement position. However, as the number and peak positions do not differ significantly, this sample is thought to be a non-uniform mixture of two components.
Fig. 3 shows the differential spectra for the two spectra in Fig. 2 (measurement position A - measurement position B and measurement position B - measurement position A).
They represent protein (A - B) and polyisoprene (B - A), respectively, suggesting that the sample is a non-uniform mixture of these two components.
3. Comparison with a Normal Area or a New Part
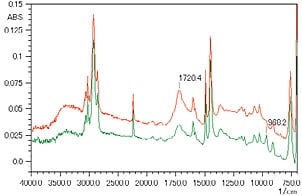
Fig. 4 Measured Spectra for Discolored Area of Resin Top: Discolored area; Bottom: Normal are
During defect analysis it is common to compare the defective area with a normal area or a new part to determine the cause of the defect. In particular, if the defect does not result from ingress of a completely different substance such as foreign matter but is due to deterioration or other change in part of the product, comparison with a normal area clarifies the differences before and after the change and indicates what kind of change occurred.
Fig. 4 shows the results of single-reflection ATR analysis (diamond prism) on both a normal area and the discolored area, after a discolored area was discovered on a resin component. Both measured spectra are the spectra for acrylonitrile butadiene styrene (ABS) resin. However, a comparison of the two reveals that the peaks in the spectrum for the discolored area near 1720 cm-1 and 3400 cm-1 are more intense than for the normal area, while the peak near 968 cm-1 is much weaker.
The peaks near 1720 cm-1 and 3400 cm-1 are thought to be C = O stretching vibrations and O - H stretching vibrations, respectively, and neither of these peaks exists in ABS resin.
The peak near 968 cm-1 is thought to result from the = C - H out-of-plane vibrations of the trans-vinylene group in the butadiene of the ABS resin. These results suggest that the discoloration resulted from oxidative degradation that broke the C = C double bonds of the trans-vinylene group, forming
a C = O group and O - H group.
4. Multifaceted Evaluation Using Other Analysis Methods
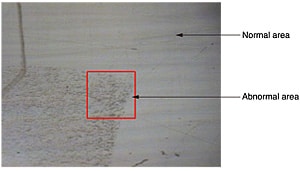
Fig. 5 Infrared Microphotograph of Abnormal Area on a Film Surface Red frame : 100×100μm
Infrared spectroscopy using FTIR is an effective method for the identification and qualitative analysis of substances when analyzing foreign matter. However, FTIR alone is often not enough to identify the foreign matter and determine the cause of the defect. Such cases require multifaceted evaluation using information obtained by other analytical methods. Instruments commonly used for foreign matter analysis include the scanning electron microscope/energy dispersive X-ray spectrometer (SEM-EDS; imaging and element information from an electron microscope) and the energy dispersive X-ray fluorescence spectrometer (EDX; easily obtains element information at atmospheric pressure). However, the analysis example presented below uses the confocal laser scanning microscope (CLSM).
Fig. 5 shows an infrared microphotograph of an abnormality discovered on the surface of a film. Numerous fine particles appear to be stuck to the surface between the center and bottom-left of the photograph. The infrared microscope ATR method that is effective for the surface analysis of minute areas was used to analyze this abnormality. Fig. 6 shows the measured results for the normal and abnormal areas. The results for both areas reveal the spectrum for polyethylene terephthalate (PET) and no obvious difference is apparent between them. It is therefore considered likely that fine powder from the PET film adhered to the film surface in the abnormal area.
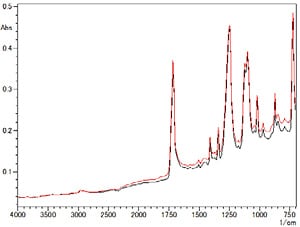
Fig. 6 Measured Results on Film Surface Black: Normal area; Red: Abnormal area
Subsequently, surface observations and 3D surface shape evaluation of the film surface were performed using a confocal laser scanning microscope (CLSM). A CLSM can take high-resolution images in air of non-conductive samples without the need for special pretreatment. The 3D surface shape evaluation simultaneously acquires information in the height direction. The magnification is from approximately 100× to 15000×.
Fig. 7 shows the CLSM image of the abnormal area of the film. The observed field is 64×48μm. A clear image was obtained that shows the particles and what appear to be scratches. Fig. 8 shows the height profile along the red line at the center of Fig. 7. In addition to the height increases expected where a particle adheres to the film surface (height of the flat film surface plus the height of the protruding particle), the height profile also reveals valley-like depressions in the film surface.
Analysis by the infrared microscope revealed both the normal and abnormal areas to be PET, and the CLSM observations and 3D surface shape evaluation revealed minute irregularities in the abnormal area of the film. This suggests not that PET particles adhered to the surface of the film, rather that the film surface is not smooth but roughened on a minute scale.
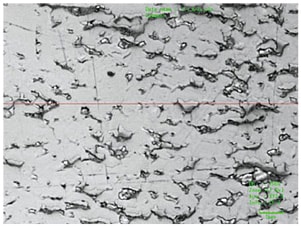
Fig. 7 Confocal Laser Scanning Microscope (CLSM) Image of the Film Surface Observed field: 64×48μm
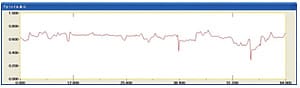
Fig. 8 Height Profile Along Red Line on Fig. 7 (Horizontal/vertical axis units:μm)
Conclusions
The final goal of the analysis of foreign matter and other defect analysis is to clarify and identify the cause of the defect. This necessitates reading the required information from the measured results. The measured results contain a range of information related to the measured target and some of this information may not be required. Alternatively, the measured results may not contain some information that is required. The first step in reading the required information from the measured results is to decide where the required information appears in the spectrum. This article introduced the most basic items for this process.