Analyzing Mineral Water Using Multivariate Analysis
In recent years, multivariate analysis has been commonly used in chemical measurement fields for quantitative analysis of mixtures or for classifying multiple samples. Using multivariate analysis enables more easily quantifying the content of target components in mixture samples and classifying a larger number of samples. This article describes utilizing mineral water's characteristic absorption spectrum in the UV region to perform various kinds of analyses using multivariate analysis.
1 Overview of Multivariate Analysis
Multivariate analysis is a technique of statistically analyzing multiple sets of analytical data to provide information not available using previous data analysis methods. It is sometimes called chemometrics when used in chemical measurement fields.
Multivariate analysis comprises a wide variety of techniques, but these can be categorized as either quantitative methods or classification methods.
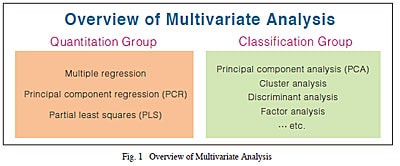
Quantitative methods include multiple regression (multiple linear regression (MLR) or inverse least squares (ILS)), principal component regression (PCR), and partial least squares (PLS). Using such techniques allows determining the quantity of each component (or target components) in a sample containing a mixture of components. Multiple regression requires that the analyst select specific data (descriptive variables), but that is not required using PCR and PLS techniques, which allow using all data. However, PCR and PLS are more susceptible to the effects of noise (data variability) than multiple regression. Classification methods include principal component analysis (PCA), cluster analysis, discriminant analysis, and factor analysis. Using such techniques allows classifying multiple samples based on similarities to understand their characteristics or help identify where they were produced. Fig. 1 shows an overview of multivariate analysis. In this article, multiple regression was selected as the quantitative method and principal component analysis (PCA) and cluster analysis were selected as the classification methods to illustrate multivariate analysis.
2 Simultaneous Quantitation of Mineral Water Mixture Samples Using Multiple Regression
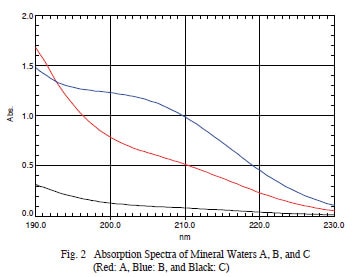
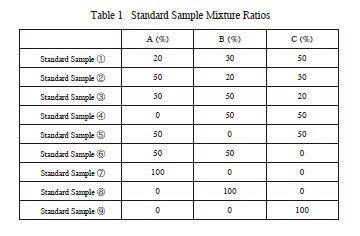
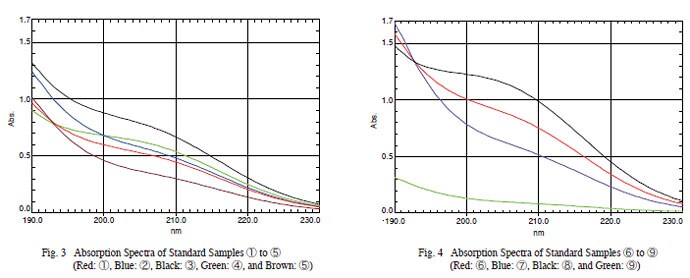
Multiple regression allows determining the quantity of each component (or target components) in a sample containing a mixture of components. In this example, three commercial brands of bottled mineral water – A, B, and C, were mixed in various proportions, then multiple regression was used to determine the mixture ratio of each sample. First a calibration model was created using standard samples prepared by varying the mixture ratio. Then samples with known mixture ratios were prepared for verification of the calibration model. The UV absorption spectra of nine standard samples and three verification samples were measured using a UV-3600 UV-VIS-NIR spectrophotometer. The absorption spectra for each brand of mineral water, measured using a quartz cell with a 10 mm optical path length and ion-exchange water as a reference, are shown in Fig. 2. Mixture ratios of the standard and verification samples are indicated in Tables 1 and 2. Results from measuring these mixtures are shown in Fig. 3 (standard samples ① to ⑤), Fig. 4 (standard samples ⑥ to ⑨), and Fig. 5 (verification samples ① to ③).
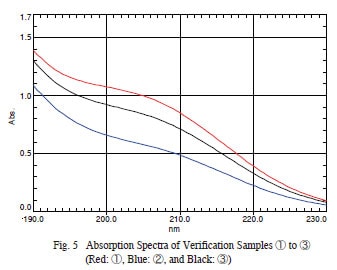
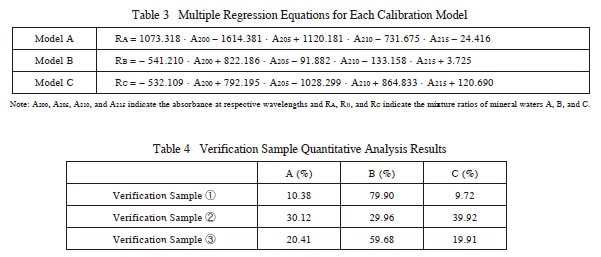
Calibration models (multiple regression) were created for each mineral water using the absorption at four wavelengths – 200 nm, 205 nm, 210 nm, and 215 nm. (1) The multiple regression equation for each model is shown in Table 3. The multiple correlation coefficients for the calibration models for mineral water A, B, and C are 0.999921, 0.999986, and 0.999973, respectively.
The multiple correlation coefficients indicate the correlation between the actual and predicted measurement values, where predicted values are calculated using the multiple regression equations. The mixture ratio of each sample was calculated by replacing the absorbance in the multiple regression equations with absorbance values obtained from verification samples at four wavelengths. Quantitative analysis results are indicated in Table 4. A comparison with Table 2 shows that good results were obtained. Multiple regression methods, which are able to utilize absorbance from multiple wavelengths, are especially useful for simultaneous quantitative analysis of multiple components, as shown in this example.
3 Classification of Mineral Waters Using Principal Component Analysis (PCA)
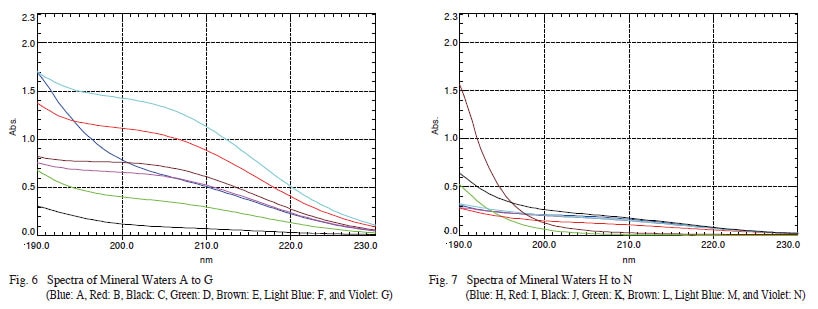
The following describes an example of using principal component analysis (PCA). A total of 20 absorption spectra ( to T) for 19 mineral water samples and one tap water sample is shown in Fig. 6 to Fig. 8.
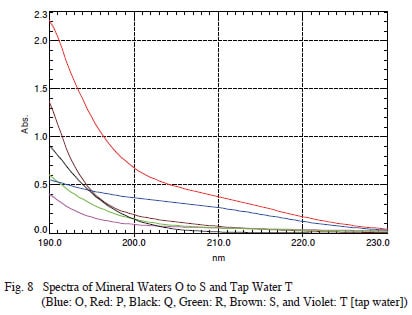
Principal component analysis was used to analyze these 20 spectra. (2) All data obtained for the measurement range of 190 nm to 230 nm were used in the analysis. The score plot obtained is shown in Fig. 9. The score plot indicates the scores corresponding to principal component Groups 1 and 2, plotted on a coordinate plane, resulting in 20 points corresponding to measurement samples plotted on a graph. The horizontal axis corresponds to Group 1 principal components and the vertical axis corresponds to Group 2 principal components. In this case, "principal components" represent some sort of characteristic assigned in mathematical terms. It indicates that samples with principal component points plotted close to each other are similar. Fig. 10 shows spectra for samples in the circled showing how spectra within the same group are very similar.
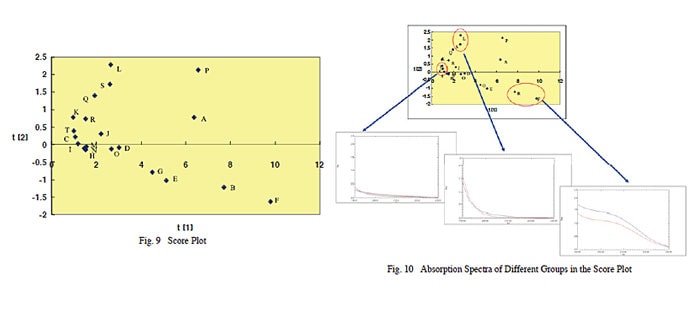
Fig. 11 shows the spectra corresponding to plot points at select points along the horizontal axis (Group 1 principal components). Similarly, spectra for select plot points on the vertical axis (Group 2 principal components) are shown in Fig. 12. Presumably, the horizontal axis corresponds to total absorption (spectral area), whereas the vertical axis corresponds to spectral shape (based on whether or not there is a bulge near the center of the spectrum). (The validity of this presumption can be confirmed by viewing a graph called a loading plot, the explanation of which is omitted here.) Total absorption values probably correspond to the total ions and other items dissolved in the sample, whereas spectral shape probably corresponds to the type of ions and so on. By analyzing the principal components of multiple samples, it is possible to visually understand the similarities between samples.
4 Classification of Mineral Waters Using Cluster Analysis
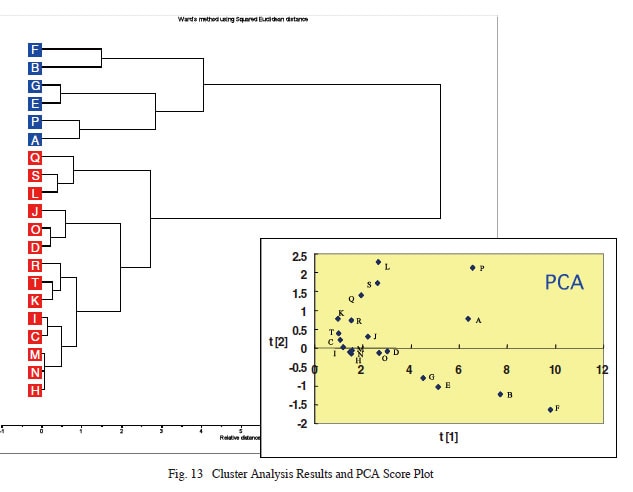
Cluster analysis, which is a separate classification method than principal component analysis (PCA), allows displaying all samples by using a dendrogram to diagram the order of similar samples. Given the 20 kinds of mineral water described above, results from cluster analysis are shown in Fig. 13. (3) In this example, the Ward's method was used for calculation in cluster analysis. Fig. 13 shows a cluster diagram along with the PCA. It shows how cluster analysis provided similar results to PCA. The dendrogram enables understanding the similarity between data and clusters.
5 Summary
This article described how using multiple regression enabled simultaneously quantitating mixtures of three kinds of mineral water. It also described using principal component analysis to express the characteristics of 20 kinds of mineral water in terms of a score plot and described using cluster analysis to further summarize characteristics in a dendrogram.
These classification methods provided a visual understanding of the similarities between samples. In addition to the analysis examples described above, multivariate analysis is also used for a wide variety of other situations. For example, multivariate analysis is used in simple spectrometers for scanning tangerines, apples, and other fruit, to measure their sugar and acid content. It is also used in many other applications, such as to identify the origin of vegetables, classify odors, evaluate the effectiveness of cosmetics, and measure the fat content of fish. Application fields are diverse as well, and include food products, chemicals, life sciences, pharmaceuticals, electrical, and semiconductors. With so many ways available to view analytical data, multivariate analysis will no doubt continue to be widely used in the future.
(1) Calculated using Excel® spreadsheet software. Excel is a registered trademark of Microsoft Corporation.
(2) and (3) Calculated using The Unscrambler® multivariate analysis software. The Unscrambler is a registered trademark of CAMO Software.