The Structure of a Spectrophotometer
The basic measurement principle used by a spectrophotometer is relatively
simple and easy to understand. I will explain the principle as it applies to
solid samples and solution samples separately
1.The Measurement Principle Used by a Spectrophotometer
The basic measurement principle used by a spectrophotometer is relatively simple and easy to understand. I will explain the principle as it applies to solid samples and solution samples separately.
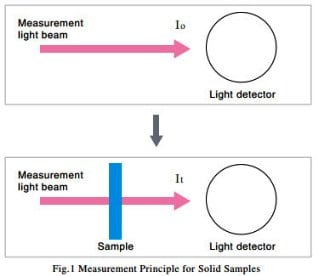
(1) Solid Samples
As shown in Fig. 1, first the intensity of the measurement light beam, I0, is measured without the sample set. Then the sample is set in the path of the measurement light beam, and the intensity of the light beam after it passes through the sample, It, is measured.
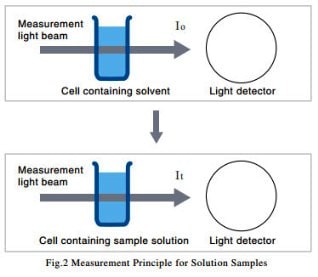
(2) Solution Samples
As shown in Fig. 2, a cell containing solvent is set in the path of the measurement light beam, and the intensity of the light beam after it passes through the cell, I0, is measured. Next, a cell containing a solution produced by dissolving the sample in the solvent is set in the path of the measurement light beam, and the intensity of the light beam after it passes through the cell, It, is measured. The transmittance, T, is given by equation (1), but with solution samples, it is more common to use the absorbance, Abs, which is given by equation (2).

Equation (3), which expresses the relationship between the absorbance, Abs, and the sample concentration, C, is called the “Lambert-Beer law”. There is a proportional relationship between the absorbance and concentration, and this forms the basis of quantitative analysis.
Here, ε is the sample’s absorption coefficient and L is the cell’s optical path length.
The measurement method shown in Fig. 2 eliminates the influence of reflection from the cell surface and absorption by the solvent, and ensures that only the absorption due to the sample is measured.
Monochromatic light is usually used for the measurement light beam shown in Fig. 1 and Fig. 2. Monochromatic light is light that consists of a single wavelength. To be precise, it has a spectral bandwidth (slit width). For example, monochromatic light with a wavelength of 500 nm and a spectral bandwidth of 2 nm is light that covers a wavelength interval (full width at half maximum) spanning 499 and 501 nm.
2.The Configuration of a Spectrophotometer
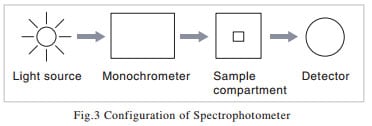
You will find from the above explanation that the indispensable elements of a spectrophotometer consist, as shown in Fig. 3, of a light source, a spectrometer, a sample compartment, and a detector. Although I said in the previous section that the sample is exposed to monochromatic light, there are instruments in which white light is passed through the sample before being passed into the spectrometer. This method is employed in high-speed photometry instruments that use array detectors. In the next sections, I will give an explanation of each element.
3.Light Source
The desirable properties of a light source are as follows:
a) Brightness across a wide wavelength range
b) Stability over time
c) A long service life
d) Low cost
Although there are no light sources that have all of these properties, the most commonly used light sources at the moment are the halogen lamps used for the visible and near-infrared regions and the deuterium lamps used for the ultraviolet region. Apart from these, xenon flash lamps are sometimes used.
(1) Halogen Lamp
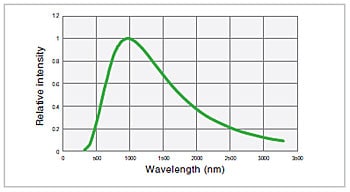
Fig.4 Emission Intensity Distribution of Halogen Lamp (3,000K)
The principle for light emission is the same as that for a standard incandescent bulb. Electric current is supplied to a filament, the filament becomes hot, and light is emitted. The bulb in a halogen lamp is filled with inert gas and a small amount of a halogen. While the tungsten used as the filament evaporates due to the high temperature, the halide causes the tungsten to return to the filament. This helps create a bright light source with a long service life. The emission intensity distribution of a halogen lamp can be approximated using Planck’s law of radiation. Fig. 4 shows the emission intensity distribution for a temperature of 3,000 K. A halogen lamp offers superior temporal stability, a service life of approx. 2,000 hours, and a relatively low cost. It has relatively high levels of each of the properties a) to d) mentioned above.
(2) Deuterium Lamp
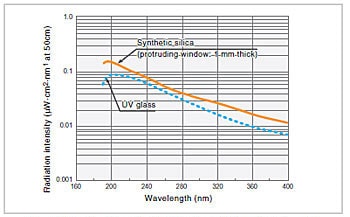
Fig.5 Emission Intensity Distribution of Deuterium Lamp1)
A deuterium lamp is a discharge light source in which the bulb is filled with deuterium (D2) at a pressure of several hundred pascals. Fig. 5 shows the emission intensity distribution for a deuterium lamp. Although 400 nm is, in general, an approximate usage limit at the long wavelength end, because the degree of attenuation at this end is quite low, light of wavelengths greater than 400 nm is used. In the region beyond 400 nm, there are also large numbers of bright line spectra. Among these, the bright line spectra at 486.0 nm and 656.1 nm are particularly intense, and can be used for the wavelength calibration of spectrophotometers. The usage limit at the short wavelength end is determined by the transmittance of the window material. In Fig. 5, the graphs for cases where synthetic silica and UV glass are used for the window material are given as examples.
4.Monochrometer

Fig.6 Cross Section of Diffraction Grating
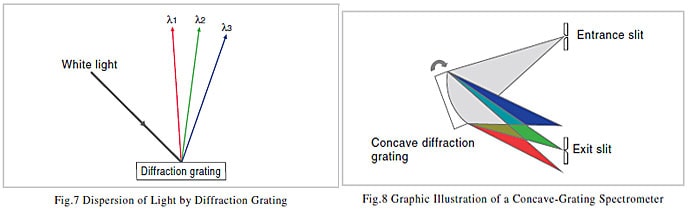
Spectroscopy is the technique of splitting light that consists of various wavelengths into components that correspond to those wavelengths. The element that splits this light is called a dispersive element. Prisms and diffraction gratings are typical dispersive elements. Prisms used to be commonly used as the dispersive elements in spectrometers, but recently, diffraction gratings have become the most commonly used type of dispersive element. The diffraction gratings used in spectrophotometers have from several hundred to approximately 2,000 parallel grooves per millimeter cut into them at equal intervals. An example of a cross-section is shown in Fig. 6.
If this diffraction grating is exposed to white light, because of interference, the white light is dispersed in a direction perpendicular to the grooves, and light components of specific wavelengths are reflected only in specific directions. This is illustrated in Fig. 7. λ1 to λ3 represent wavelengths. The wavelengths change continuously and so if a diffraction grating is exposed towhite light, it appears iridescent. The way that the clear side of a CD appearsto glitter with iridescence when it is exposed to light is based on the same mechanism as the spectroscopy performed with a diffraction grating.
5.Sample Compartment
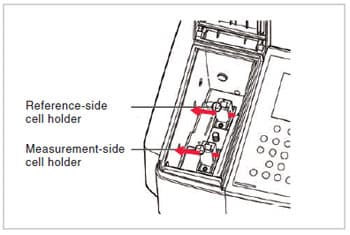
Fig. 9 shows an example of a standard sample compartment. You can see that two light beams (indicated by red arrows in Fig. 9) pass through the compartment, and that this is therefore the sample compartment of a “double-beam spectrophotometer”. The monochromatic light that leaves the spectrometer is split into two beams before it enters the sample compartment. A spectrophotometer in which only one beam passes through the sample compartment is called a “single-beam spectrophotometer”. An explanation of the difference between single-beam and double-beam spectrophotometers is given in the Q&A of previous issue of UV Talk Letter. Refer to this explanation if necessary.
In a standard configuration, the sample compartment contains cell holders that, as shown in Fig. 9, hold square cells with optical path lengths of 10 mm. The various accessories are attached by replacing these cell holder units or by replacing the entire sample compartment. Among spectrophotometers of medium or higher grade that use photomultipliers, which will be described later, as detectors, there are models for which large sample compartments are made available in order to allow the analysis of large samples or the attachment of large accessories.
6.Detector
The light beams that pass through the sample compartment enter the detector, which is the last element in the spectrophotometer.
Photomultipliers and silicon photodiodes are typical detectors used with spectrophotometers for the ultraviolet and visible regions. For the near-infrared region, PbS photoconductive elements have always been used in the past, but recently, instruments incorporating InGaAs photodiodes have been sold. Silicon photodiode array detectors are used, in combination with the back spectroscopy method, for high-speed photometry instruments. Photomultipliers and silicon photodiodes are described below.
(1) Photomultiplier
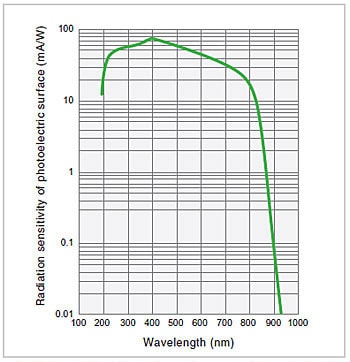
Fig.10 Spectral Sensitivity Characteristics of a Photomultiplier2)
A photomultiplier is a detector that uses the fact that photoelectrons are discharged from a photoelectric surface when it is subjected to light (i.e., the external photoelectric effect). The photoelectrons emitted from the photoelectric surface repeatedly cause secondary electron emission in sequentially arranged dynodes, ultimately producing a large output for a relatively small light intensity. The most important feature of a photomultiplier is that it achieves a significantly high level of sensitivity that cannot be obtained with other optical sensors. If there is sufficient light intensity, this feature is not particularly relevant, but as the light intensity decreases, this feature becomes increasingly useful. For this reason, photomultipliers are used in high-grade instruments. The spectral sensitivity characteristics of a photomultiplier are mainly determined by the material of the photoelectric surface. Fig. 10 shows an example of the spectral sensitivity characteristics of a multi-alkali photoelectric surface, a type of surface that is often used in spectrophotometers.
(2) Silicon Photodiode
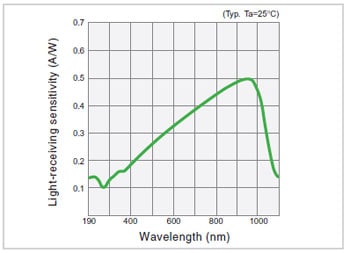
Fig.11 Spectral Sensitivity Characteristics of a Silicon Photodiode3)
A silicon photodiode is a detector that uses the fact that the electrical properties of a detector change when it is exposed to light (i.e., the internal photoelectric effect). Solar cells, which have attracted much attention recently, use the same structure and principle as silicon photodiodes.
In comparison with photomultipliers, silicon photodiodes offer advantages such as low cost, little locality of sensitivity in the light-receiving surface, and the fact that a special power supply is not required. Even regarding sensitivity, if the light intensity is relatively large, they can obtain photometric data that is no inferior to that obtained with photomultipliers. Fig. 11 shows an example of the spectral sensitivity characteristics of a silicon photodiode.
References
1) Hamamatsu Photonics Deuterium Lamp Brochure
2) Hamamatsu Photonics Photomultiplier Brochure
3) Hamamatsu Photonics Photodiode Brochure
7.Summary
Here, I have given an overview of the structure of UV-VIS spectrophotometers. Due to space limitations, I have only described the basics. In the future, I plan to give more detailed explanations about specialized topics. I look forward to your continued interest.
The basic measurement principle used by a spectrophotometer is relatively simple and easy to understand. I will explain the principle as it applies to solid samples and solution samples separately.