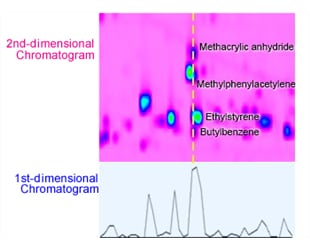
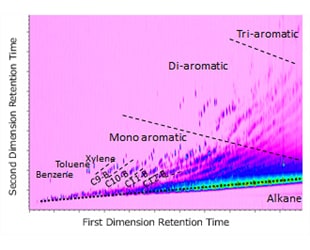
Peaks with similar boiling points that could not be separated adequately with one-dimensional chromatography can now be separated based on differences in polarity.
Comprehensive GC-MS(GC×GC-MS) System
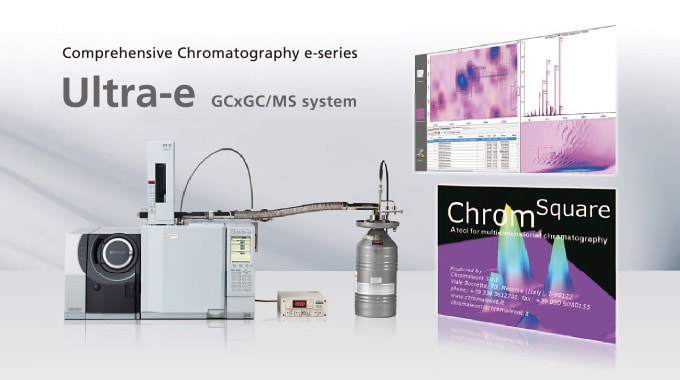
Shimadzu’s Comprehensive GC-MS (GCxGC-MS) System is suited for a variety of applications, including analysis of complex matrices such as a natural products that are hard analyze by conventional GC or GC-MS, and grouping analysis based on two-dimensional chromatograph patterns.
Nexera-e (Comprehensive Two-Dimensional Liquid Chromatograph)
Comprehensive 2DLC: Concepts, Potential, Applications
Shimadzu new products for pharmaceutical industry at Pittcon 2014
AOAC INTERNATIONAL Posters are now available.
Shimadzu has released the GCMS-QP2050
The next-generation GCMS-QP2050 gas chromatograph mass spectrometer, with its accumulation of impressive Shimadzu technology, will lead the way forward. New value is provided by hardware boasting astounding reliability and stability, and easy-to-operate software equipped with superior automated technology.
Solutions for Analysis of Ethylene Oxide and 2-Chloroethanol in Food
Even though Ethylene oxide (EtO / EO) is well-known to be a toxic compound with carcinogenic and mutagenic concerns, it has been widely used for fumigation in the food industry because it effectively reduces or eliminates microbiological contamination with bacteria/fungi. The recent recall of food products exported to the EU due to non-compliance with EU regulations has highlighted the importance of quantitation of EtO and 2-CE residues in food.
Latest issue of Shimadzu Journal, featuring Forensics / Toxicology, has come out.
This issue focuses on "Forensics / Toxicology", an area where science and technology are particularly important and needed. It starts with two customer interviews.
Qualitative and quantitative analysis of microplastics in environmental samples by pyrolysis-GC/MS
In recent years, identification and quantitation using pyrolysis-GC MS (Py-GC/MS) have been considered to evaluate the chemical properties of microplastics.
Air
Shimadzu provides analytical equipment and solutions that can monitor not only the atmospheric environment, but also indoor working environments and direct emission sources. Here are some examples of measurements of inorganic and organic components in the air and indoor environment.