Static Tensile Test of Extremely Thin Copper Foil Selection of Optimal Grips and Grip Faces (I)
There is a deeply rooted need for tensile strength tests for extremely thin copper foil used for printed circuits and packaging materials in electronic and food industry.
Practical tests, however, are often confronted with the problem of getting reliable data due to fluctuations and breakage of the specimen at the gripped portion.
Consequently, static tensile tests of extremely thin foils as thin as 0.02mm must be conduced in a manner different from general tests, taking special consideration of the following points:
1.Preparation of specimens
2.Attachment of specimens
3.Measures to avoid breakage at grips
The following is an introduction of testing methods for highly reliable test results and some ideas on grip that encourage normal breakage of the specimen.
Specimen
| Material | : | Copper foil |
| Size | : | Rectangular shape, thickness 0.02mm, width 12.5mm, length 150mm |
Testing conditions
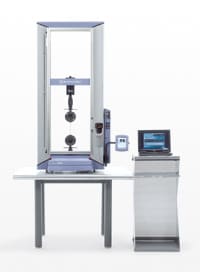
| Testing machine | : | Shimadzu universal testing machine AUTOGRAPH |
| Load cell | : | 500N |
| Ambience | : | 190 degrees Celsius in a thermostatic chamber |
| Testing speed | : | 1.5mm/min |
| Distance between grips | : | 50mm |
Examples of best fitted grips
| Type of grip | : | (A) Pneumatic flat grip, Pressure 400KPa, or(B) Screw type flat grip |
| Grip face | : | Flat type with damping material |
Preparation of specimens
Special care should be taken to finish the surface of both sides, as a small flaw may cause aberrations in test data.
Attachment of specimen
A thin and pliant specimen must be attached to the grip with care so that stress is applied evenly to the full width of the specimen.
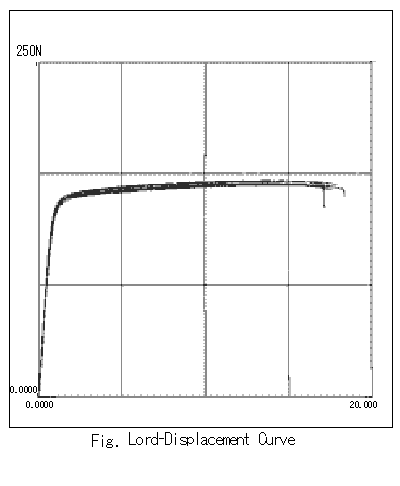
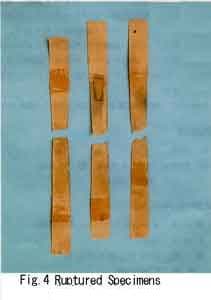
Fig.4 shows the specimen normally broken near its center and not at the gripped portion. The data of test results (tensile strength and elongation) as shown in Table 1 and Fig.3 show little fluctuation and, therefore, high reliability. Table 1 Test Results
| Specimen No. | Elongation at max. load | Tensile Strength | Elongation | |||
|---|---|---|---|---|---|---|
| kN | {kgf} | Mpa | {kgf/mm2} | mm | % | |
| 1 | 3.5 | 358.0 | 225.5 | 23.0 | 100.2 | 33.5 |
| 2 | 3.5 | 360.0 | 227.5 | 23.2 | 101.5 | 33.8 |
| 3 | 3.6 | 370.0 | 230.4 | 23.5 | 100.0 | 33.3 |
| 4 | 3.5 | 360.0 | 227.5 | 23.2 | 92.0 | 30.6 |