Strength Test and Characteristics Comparison of Tire Cord by Shimadzu Autograph Series
To compare strength characteristics of textile materials, it is general practice to increase the number of times to be tested and evaluate the resultant strength average, since configurations of samples are complicated and not consistent. Thus we also chose to perform a multiple number of lot tests when checking the strength of tire cord (nylon material) for this trial.
The Autograph series systems are enhanced in data reprocessing functions. If fine differences in characteristics are difficult to discern by the usual method of comparison between load - elongation charts, histogram processing facilitates at-a-glance understanding of features in data analysis. Shown below is an example of the Shimadzu Autograph*s histogram processing.
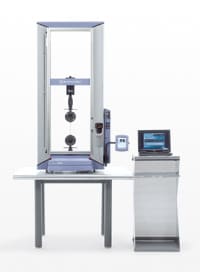
Measuring units
(1) Shimadzu Autograph
(2) 100-kgf load cell
(3) 100-kgf Pneumatic Capstan Type Grip for Yarn
Test conditions
(1) Test speed: 200 mm/min
(2) Gauge length: 200 mm
(3) Load full scale: 50 kgf
(4) Number of lots: 2
(5) Times tested: 20 per lot
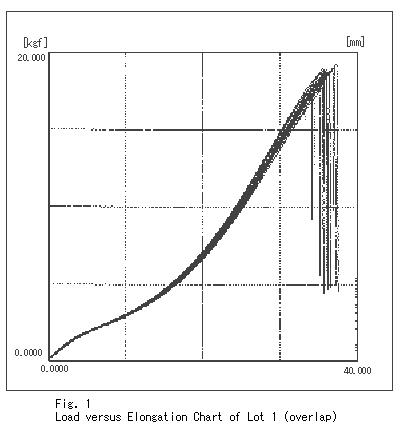
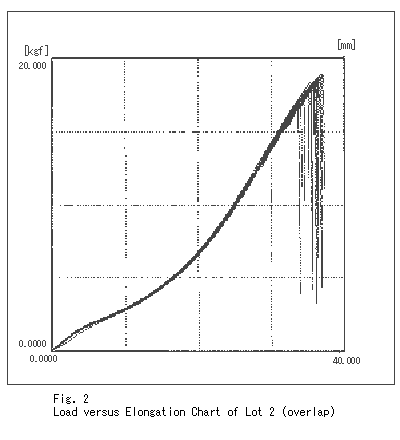
Test results
Figs. 1 and 2 display expanded and overwritten load - elongation charts for lot 1 and lot 2 (20 samples each). Figs. 3 and 4 show the respective data in histogram form with respect to the load and the elongation. The graphs in Fig. 1 and Fig. 2 overlap each other so that it is difficult to identify features of the data distributions in each of the lots. However, these features become distinct as histogram processing is applied to the data.