Lipid Analysis of a Mouse Brain by Statistical Analysis Software
The most important element of MS imaging is how efficiently it can analyze the enormous amounts of data acquired by data acquisition.
Imaging MS Solution Analysis is dedicated image analysis software for the iMScope that offers easy peak detection, Principal Component Analysis (PCA), Hierarchical Cluster Analysis (HCA), and Region of Interest (ROI) analysis. Peak detection and PCA were performed on MS imaging data of a mouse brain slice to obtain lipid groupings with the three different types of distribution characteristics that match the brain structures. It was demonstrated that overlaying a micrograph over these lipid distributions can visualize the localized distributions.
*Sales area: All areas excluding North America
MS Imaging and Data Analysis
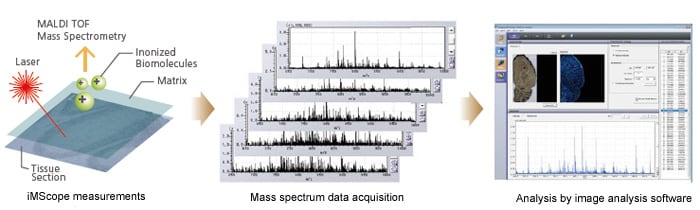
MS imaging involves using a mass spectrometer to capture the ionized materials generated by continuous irradiation by fine laser shots across the two-dimensional space of a tissue slice as a mass spectrum. Planar images are created from the m/z, positional information, and signal intensities in the obtained data.
The iMScope imaging mass microscope can acquire up to 250 x 250-pixel mass spectra from each data acquisition at a resolution offering a minimum pitch of 5 μm and allowing data acquisition from extremely small regions. The iMScope is supplied with Imaging MS Solution Analysis dedicated image analysis software for accurate data analysis.
"Imaging MS Solution Analysis" Image Analysis Software
The "Imaging MS Solution Analysis" image analysis software used with the iMScope imaging mass microscope offers peak detection, Principal Component Analysis (PCA), Hierarchical Cluster Analysis (HCA), and Region of Interest (ROI) analysis. It accomplishes this diverse range of analyses without the need for tedious parameter setup of the analytical methods.
Principal Component Analysis (PCA) extracts the peak matrix from the mass spectrum and searches for principal components as characteristic patterns in the images. It detects values with a specific distribution and then searches for other values with a similar distribution.
Hierarchical Cluster Analysis (HCA) compares the m/z images to analyze similar m/z images as clusters (groups). The distance between clusters (mismatch factor) is used to evaluate the similarity for each cluster. The similarity can be confirmed by displaying the tree diagram and mismatch factor information.
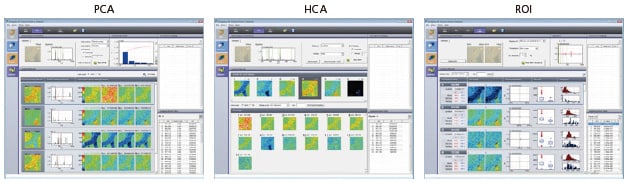
Fig. 1 Data Analysis Software
Region of Interest (ROI) analysis is performed to test for intensity differences between multiple designated ROI or inside and outside ROI in a single batch of imaging data. The p value indicates the probability of no intensity difference existing, with respect to the null hypothesis that no ion intensity difference exists. The smaller the p value, the higher the probability that an intensity difference exists; that is, whether each region specified as an ROI contains molecules with m/z values that have a characteristic distribution. For example, performing ROI analysis with separate ROI specified for cancerous and non-cancerous regions within the same tissue can detect molecules that are specific to the cancerous region.
MS Imaging of a Mouse Brain Slice
Analysis Conditions
Table 1 Target pharmaceuticals and method performance
| Sample | Mouse brain slice (approx. 10 μm thick) |
| Glass Slide | ITO glass (Sigma Aldrich #578274) |
| Measuring Instrument | iMScope |
| Matrix | DHB (spray) |
| No. of Pixels | 110 x 213 |
| Spatial Resolution | 50 μm |
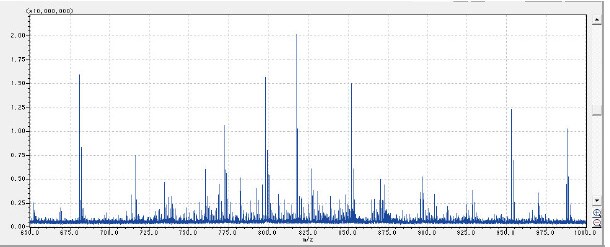
| Measuring Range (m/z) | 650.000 to 1000.000 |
| Measuring Time | 7 minutes |
| Peak Picking | Automatic (100 peaks) Excluding certain matrix peaks |
| PCA Analysis | Automatic (default setting) |
Over laying a Micrograph
Fig. 4 shows the micrograph overlaid on the characteristic localized molecular species in each region that was identified by PCA analysis.
Although this analysis was performed at 50 μm spatial resolution, it is apparent that a good match was achieved between the molecular distributions and micrograph, even in regions with an extremely fine structure, such as the corpus callosum and hippocampus. Imaging MS Solution Analysis software offers display functions for the overlay of optical images and m/z images and the overlay of multiple m/z images. It easily displays accurate overlay images, without the need for detailed positional adjustments. Similar overlay images are also available for MS-MS analysis data.
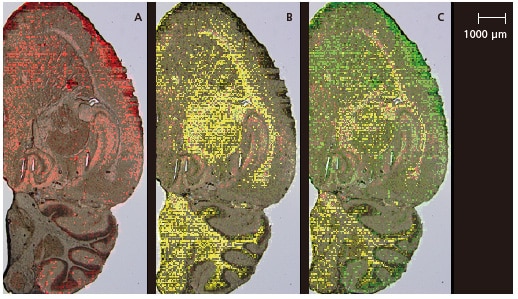
Fig. 4 Overlaid Optical Images
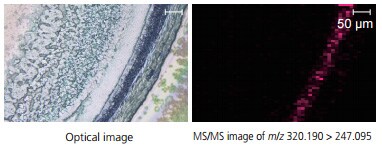
Fig. 2 MS/MS Imaging of Rat Retina, Showing the Spatial (Distribution of Chloroquine m/z 320.190 247.095)
iMScope TRIO
Imaging Mass Microscope
Imaging mass spectrometry is a revolutionary new technology.
The instrument is a combination of an optical microscope which allows the observation of high-resolution morphological images, with a mass spectrometer which identifies and visualizes the distribution of specific molecules.