Comprehensive two-dimensional liquid chromatography for the characterization of aqueous phase from pyrolysis of lignocellulosic biomasses
Introduction
Renewable energy resources can be one of the potential alternative solutions to fossil fuels and their derivatives and among them biomass is one such promising alternative and has a worldwide abundance; the conversion of biomass into products with high added value is achieved by the pyrolysis that is a thermochemical process (350 °C to 700 °C) in the absence of air, causing thermal cracking of naturally occurring biomolecules (cellulose, hemicelluloses, lignin etc.) into simpler organic molecules. The liquid product obtained by pyrolysis can be separated into two fractions according to their water solubility: the water insoluble fraction is viscous, and denser than the water soluble (usually named bio-oil) is made up of many oxygen-containing functional groups which include acids, aldehydes, ketones, phenols, furans, and sugars; the water-soluble phase predominately consists of low-molecular-weight acids and aldehydes, ketones with high reactivity, as well as phenolic compounds that provide smoky flavors. To avoid the needed extraction step due to the unsuitability of water samples in GC applications, the aqueous phases from bio-oils obtained from three different biomasses are hereby separated by comprehensive LC (LCxLC) in combination with PDA and atmospheric pressure chemical ionization mass spectrometry (APCI-MS).
Experimental
Sample and sample preparation
Biomasses from coconut fibers, sugarcane straw and sugarcane bagasse were previously ground in a knife mills and subjected to the drying process in an oven for a period of 48 hours at 120 ºC. The bio-oils were obtained from fast pyrolysis of biomasses in a fixed bed reactor.
Instrumentation
Analyses were performed on a Shimadzu Prominence system (Shimadzu, Milan, Italy), consisting of a CBM-20A controller, two LC-20AD dual-plunger parallel-flow pumps (employed for the first dimension 1D separation), a LC-20AB solvent delivery module equipped with two dual-plunger tandem-flow pumps for the second dimension (2D) separations, a DGU-20A3 on-line degasser, a CTO-20A column oven, a SIL-20AC autosampler, a SPD-M20A photo diode array detector (2.5 µL detector flow cell volume) and a LCMS-2020 single quadrupole mass spectrometer. Both dimensions were connected using an electronically controlled 2-position 10-port switching valve (Supelco, Bellefonte, PA, USA) placed inside the column oven and equipped with two identical 10 µL sample loops. The system was controlled by the LabSolution software, Version 5.41 SP1 (Shimadzu, Milan, Italy). Data were collected from 200 to 350 nm using a sampling rate of 12.5 Hz and a 0.08 sec during all the whole analysis time.
The chromatograms were extracted at a 280 nm wavelength. The LCxLC data were visualized in two and three dimensions using Chromsquare Version 2.0 (Shimadzu, Kyoto, Japan).
LCxLC-MS-MS Analysis
1D separations were carried out using an Ascentis RP-Amide (250 x 1 mm, 5 µm d.p.) column (Supelco, Bellefonte, PA, USA), using a flow rate of 10 µL min-1 which was precisely verified using a microsyringe and a stopwatch. The mobile phases employed were (A) water and (B) acetonitrile, eluted according to the following gradient: 0 min, 5% B; 120 min, 100 % B; 150 min, 100 % B. The injection volume was 2 µL and the oven temperature was 40 °C. 2D separations were carried out using an Ascentis Express C8 (30 x 3.0 mm, 2.7 µm d.p.) column (Supelco, Bellefonte, PA, USA). The mobile phase employed were (A) water and (B) acetonitrile, eluted according to the following gradient: (0-80 min) 0 min, 2 % B; 0.7 min, 10 % B; 0.79 min, 10 % B; 0.80 min, 2 % B; 1.0 min, 2 % B; (80-150 min) 0 min, 5 %B; 0.79 min, 15 % B; 0.80 min, 5 % B; 1.0 min, 5 % B. The flow rate employed was 3.0 mL min-1 a it was reduced to roughly 1 mL min-1 through a T-piece union prior to the MS detection. The oven temperature was 40 ºC. MS acquisition was performed using the APCI interface operating in both positive and negative ionization modes, under the following conditions: mass spectral range: 50-400 m/z; event time: 0.3 sec; scan speed: 1250 u/s; nebulizing gas (N2) flow: 2.0 L min-1; drying gas (N2) flow: 10 L min-1; Heat block temperature: 200 °C; desolvation line (DL) temperature: 250 °C; DL voltage: -34 V; probe voltage: -4.5 kV; Qarray DC voltage: 1.0 V; Qarray RF voltage: 60 V; detection gain: 1.0 kV.
Results and discussion
Prior to separation of the samples, a standard mixture of fourteen compounds was analysed on the LCxLC system, for optimization purposes and results are shown in Figure 6.1.
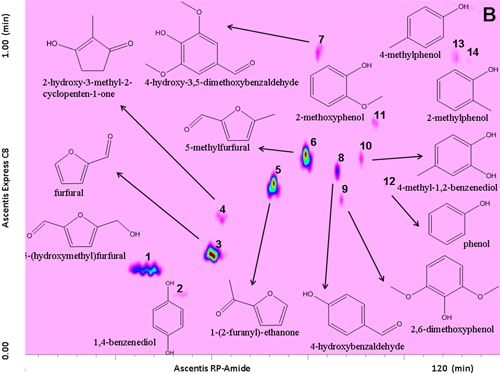
Figure 6.1. RP-LCxRP-LC-PDA (λ=280 nm) contour plot of a reference standard mixture along with their chemical structures.
For this task, an RP-Amide column (RPA) in the 1D and a partially porous octylsilica column (C8) in the 2D were employed. Optimization was carried out taking into consideration that each fraction injected onto the secondary column had to be completely eluted before the following transfer occurred thus keeping the 2D analysis time as short as possible (1 min), not to impair the separation achieved in the 1D. To this regard, for 2D analyses, a very high flow rate (3 mL min-1) was employed. Different gradients of increasing acetonitrile in water both in the 1D and the 2D dimension, were tested.
The use of a segmented gradient turned out to be the most effective, yielding the highest peak capacity and increasing the orthogonality degree. In order to ensure peak focusing at the head of the 2D column, a gradient program starting with 98% concentration of the weaker solvent (water), was adopted, considering the short reconditioning time used (12 s) which enabled the application of fast repetitive gradients (every 1 min). The RP-Amide column, probably due to the polar embedded RP phase, provided enough separation selectivity, in combination with a C18 column, making such a combination an interesting opportunity for RP-LCxRP-LC separations. In fact, as it can be seen, all the target compounds, which can be considered as representatives of the samples tested, are separated with a satisfactory degree of orthogonality. Figure 6.2 shows the LCxLC-PDA-APCI-MS chromatograms obtained for the aqueous phases from pyrolysis of coconut fibers, whereas the identified compounds namely furans, ketones, phenols and alcohols in the three samples are presented in Table 6.1.
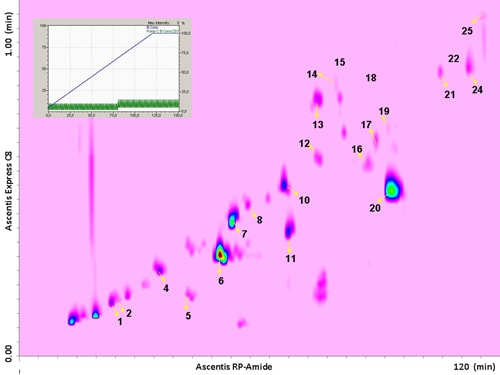
Figure 6.2. RP-LCxRP-LC-PDA (λ=280 nm) contour plot obtained for the aqueous phase from pyrolysis of coconut fibers with the peak number of identified compounds. For the peak assignment, see Table 6.1.
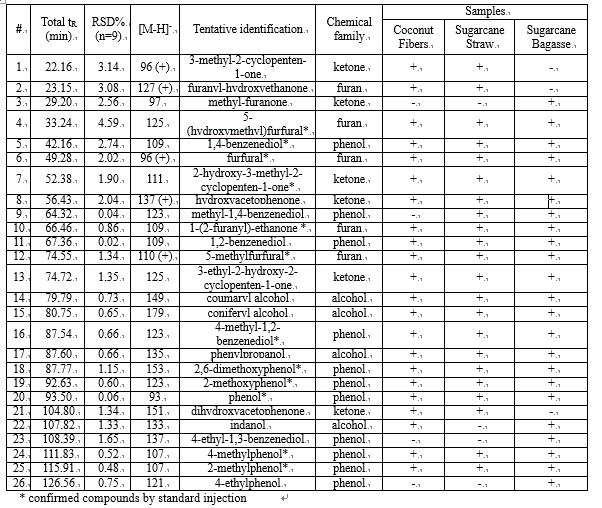
Table 6.1
The use of APCI-MS detection is hereby reported for the detection of polar and low molecular weight (m/z ≤ 179) compounds in aqueous phase of bio-oils by LCxLC. Phenols and alcohols were detected by APCI-MS in negative ionization mode as [M-H]- because of the presence of hydroxyl functional group, whereas most ketones and furans in the positive ionization mode, as [M]+ or [M+H]+.
The use of RP-LCxRP-LC, due to an increased peak capacity, turned out to be a viable tool for characterization of aqueous phases from pyrolysis of lignocellulosic biomasses. Being phenols, ketones and furans the principal classes of identified compounds, the aqueous phase obtained in pyrolysis process after the separation of bio-oils, may have several employments in food and chemical industry.