Simplified approach for structural elucidation and quantitation for pharmaceutical API and related impurities
Structural elucidation for pharmaceutical impurities involves multitude of analytical techniques, such as NMR, mass spectrometry, infrared spectroscopy etc. A sound decision can be made by compiling the shortlisted candidates from different tools and mapping them appropriately. Nevertheless, highly probable structure(s) can be predicted using HR-MS technique, along with prior background information.
This study has been carried out for structural elucidation of paracetamol and its related impurities followed by quantitation of representative impurities using LCMS-9030 (Shimadzu Corporation, Japan), a Quadrupole Time of flight liquid chromatograph mass spectrometer.
The LCMS-9030 is built using a remarkably stable TOF tube iRefTOFTM, to deliver both high resolution and accurate mass with stability; attributes essential for compound identification, confident formula assignment and quantitation.
Introduction
Various guidelines require the impurities of drug substance and drug product be structurally identified and quantitated based on dosage. Source of these impurities could be innumerable based on raw material, process, product, packaging etc.
In this study, a workflow is demonstrated (Figure 1) for deducing probable structure of Paracetamol related impurities using Shimadzu LCMS-9030 and Insight Explore software.
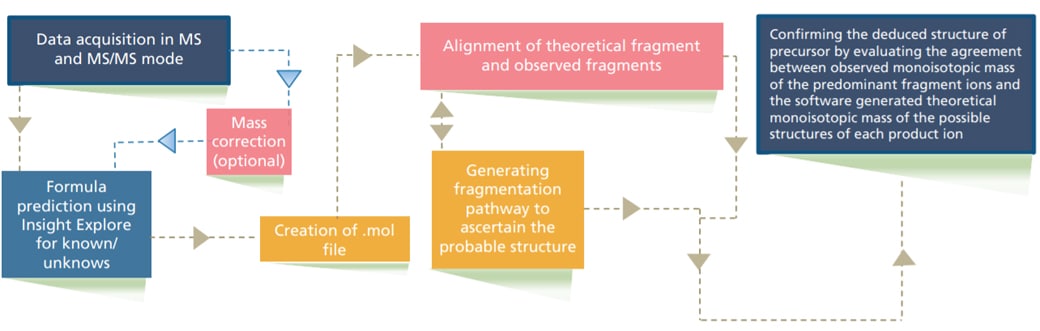
Figure 1. Experimental workflow for determination of impurities using LCMS-9030
Methods
Sample Preparation
Paracetamol standard and sample were prepared by dissolving 50 mg in 5 mL of diluent (water : methanol 85:15 v/v). Impurity standards were prepared by dissolving 5 mg of impurity 2/ 4/ J/ K/ L individually in 50 mL diluent. 10 mL of impurity standards were further diluted to 100 mL with diluent. All the standards and sample were then used for qualitative analysis. To demonstrate the quantitative capability of LCMS-9030, paracetamol standard ranging from 50 ppb to 500 ppb while impurity 4 and impurity J standards ranging from 100 ppb to 1000 ppb were analyzed.
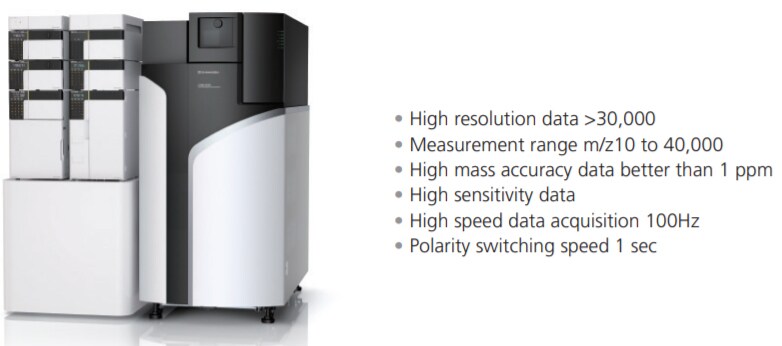
Figure 2. LCMS-9030 Quadrupole Time of flight liquid chromatograph mass spectrometer
LC-MS/MS analysis
The LCMS-9030 quadrupole time-of-flight (Q-TOF) mass spectrometer integrates the world's fastest and most sensitive quadrupole technology with TOF architecture. A product of Shimadzu's engineering DNA, speed and effortless performance enable the LCMS-9030 to address qualitative and quantitative challenges with genuine confidence and ease.
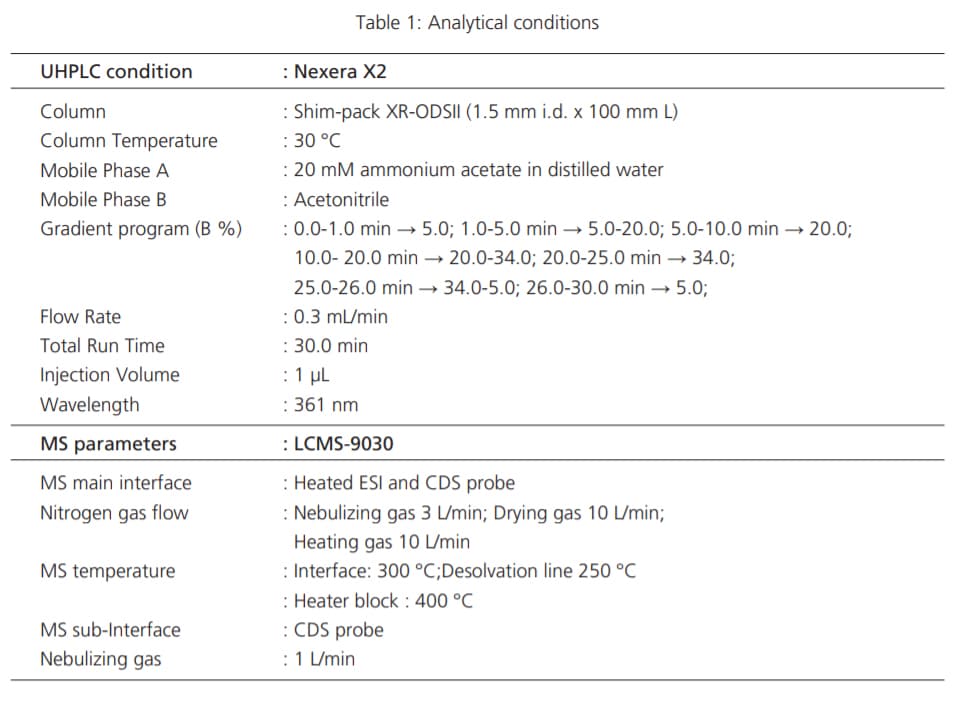
Detailed experimental conditions for LC and MS are described in Table 1.
Results and Discussion
Known impurity structural confirmation
Paracetamol and its known related impurities were analyzed in Electro Spray Ionization (ESI) positive mode of LCMS-9030 to assess the structural interpretation of known impurities in order to get a direction for interpretation of unknown components. The observed mass to charge ratio (m/z) and their respective mass accuracy are given in Table 2. Mass accuracy for all the analyzed components was found to be less than 2 ppm, through out the experiment.
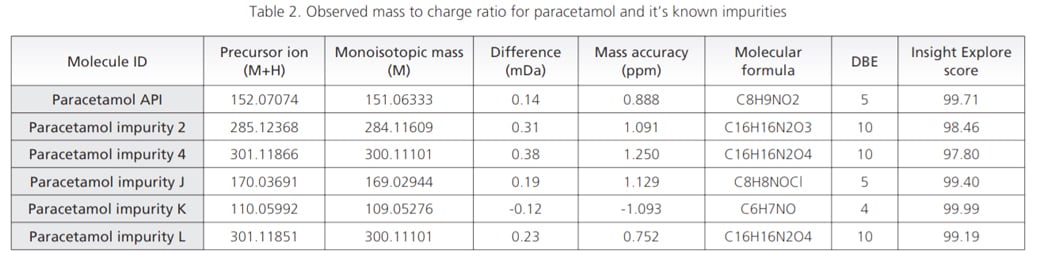
Predicted formulae from Formula predictor module of Insight Explore software correctly correlated with the observed masses with prior knowledge.
Observed mass spectrum and fragmentation pattern are showed in Figure 3. Based on this information .mol files were generated using Chemsketch software for the precursor and fragment ions of the standard and known impurities.
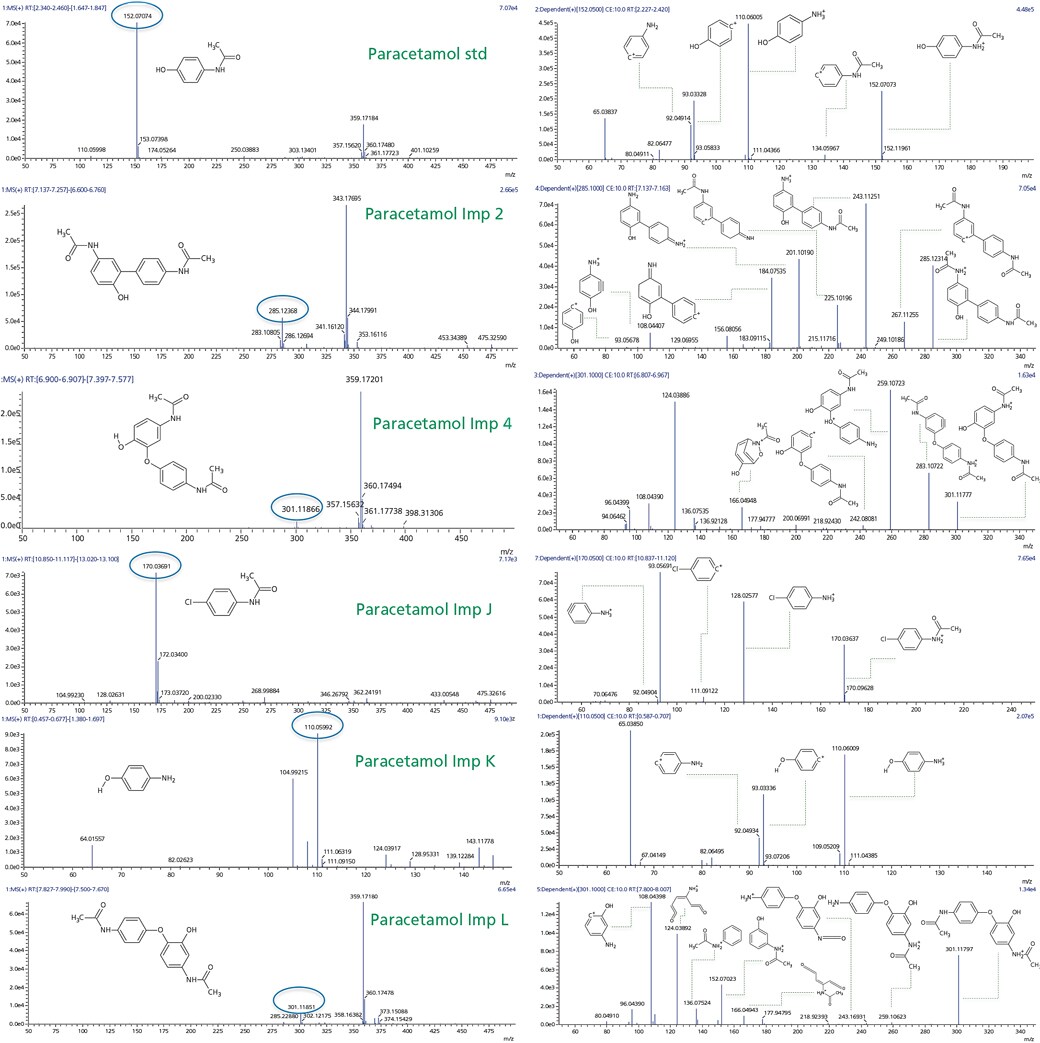
Figure 3. MS and MSMS spectra for paracetamol standard and its known impurities
Unknown impurity structural elucidation
Workflow was similarly extended to sample wherein UV chromatographic pattern reflected 3 impurities as shown in Figure 4. Accurate mass identification and MSMS fragmentation pattern of these 3 impurities were used to predict molecular formula with mass accuracy of about 1 ppm or less as shown in the Table 3 and Figure 5.
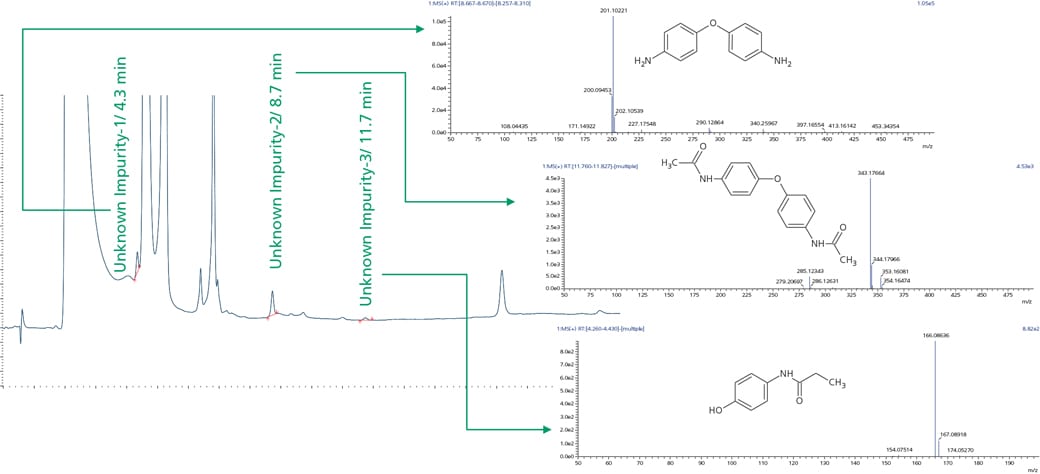
Figure 4. Sample showing retention time and MS spectra for paracetamol unknown impurities
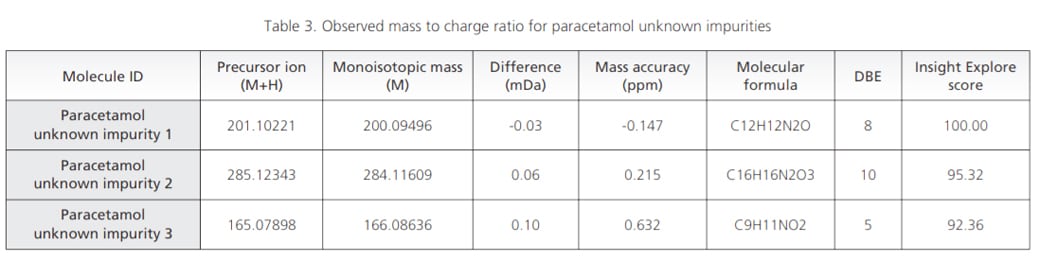
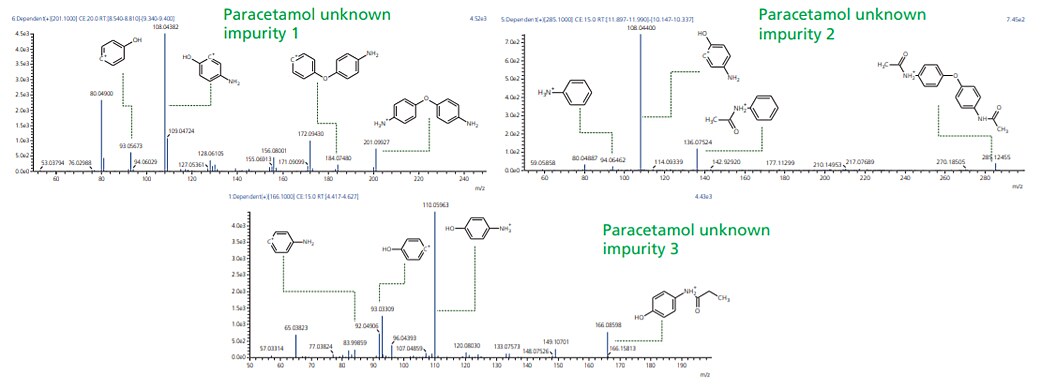
Figure 5. MSMS spectra for paracetamol unknown impurities
Quantitation of paracetamol and its known impurities
Linearity plots of paracetamol standard ranging from 50 ppb to 500 ppb while known impurity J and impurity 4 ranging from 100 ppb to 1000 ppb showed correlation coefficient value greater than 0.99 as shown in the Figure 6.
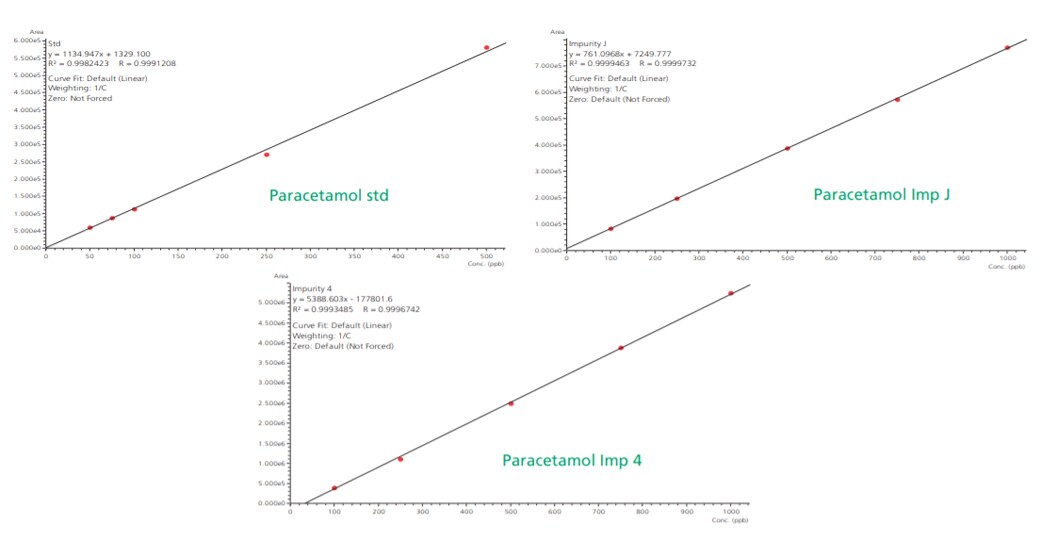
Figure 6. Linearity plots for paracetamol unknown impurities
Conclusion
- The LCMS-9030 with newly patented technologies viz. UFgrating, iRefTOF and UF-FlightTube resulted in mass accuracy values less than 2 ppm through out the analysis.
- Insight Explore software based on highly accurate LCMS-9030 data simplified the process of formula prediction and assignment leading generation of effective workflow for structural elucidation.
- Linearity plots for paracetamol standard, impurity J and impurity 4 with correlation coefficient values greater than 0.99 suggests potential for simultaneous qualitative and quantitative analysis.