High-Sensitivity Analysis of Drugs in Ultra-Small Volume Plasma Samples Using Microflow LC/MS/MS
It is known that drugs and other xenobiotics are generally subject to metabolism in the body, which facilitates their detoxification and elimination from the body. Therefore, pharmacokinetic (PK) studies of the metabolic fate of drugs in the body are conducted by preclinical and clinical tests as part of the drug development process (1). In preclinical PK studies, the concentration of drugs and their metabolites in biological samples obtained from animal experiments is analyzed by LC/MS/MS.
However, since the size of the animal model generally limits the amount of sample volume that can be taken safely, a large number of animals and a significant volume of drug may be necessary for the evaluation, and this becomes an issue from the ethical and economic point of view. An effective approach to overcome those issues, together with the use of micro sampling technology, is the development of high sensitivity LC MS/MS methods that allows drug detection from the small amount of sample.
This article introduces an example of a high-sensitivity microflow LC/MS/MS method, for the analysis of drugs in ultrasmall volume plasma samples.
Nexera Mikros™ Microflow Liquid Chromatography Mass Spectrometry System
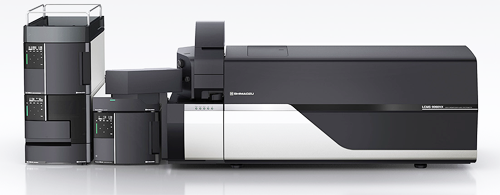
Fig. 1 Nexera Mikros™ Microflow LC-MS System
This study was conducted using a Shimadzu Nexera Mikros (Fig. 1), which can be used effectively in a wide range of flow rates from the microflow region to the semi-microflow region (1 to 500 μL/min). The Nexera Mikros can detect target components with higher sensitivity than the semi-microflow LC/MS systems in general use, which operates in the flow rate range of approximately 100 to 500 μL/min, and also offers excellent robustness and shorter analysis times in comparison with nano LC/MS system, which operates in a flow rate range of several 100 nL/min to 1 μL/min.
Fig. 2 shows the flow diagrams during trapping and during elution. Because acetonitrile is commonly used as a sample solvent for deproteinization, the peak shape in direct injection is broadened due to the elution strength of acetonitrile, and this limits the injection volume. In order to overcome this broadening of the peak by the sample solvent, the trap & elute injection method is used in the Nexera Mikros system. After the target compound is retained in the trap column (trap), the column is backflushed with the analytical mobile phase by switching a valve, and the target compound is transported to the analytical column (elute) for separation and detection.
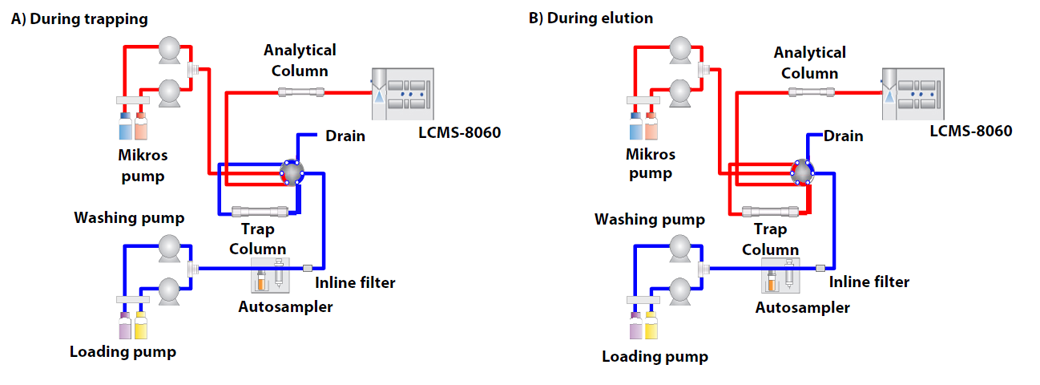
Fig. 2 Flow Diagrams of Trap and Elute System
Sample Preparation
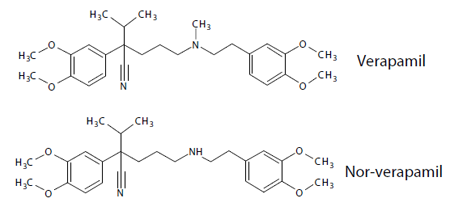
Fig. 3 Chemical Formulas of Verapamil and its Metabolite Nor-Verapamil
Plasma samples (2 μL) were prepared by spiking with Verapamil and Nor-Verapamil, which are shown in Fig. 3. The spiked samples were diluted by adding 58 μL of a precipitant solution (containing acetonitrile + formic acid 0.1 % and a labelled internal standard, Verapamil-D6). After allowing the samples to stand quietly for 20 min (incubation) at a room temperature, the samples were centrifuged and the supernatant was transferred to a vial, and 5 μL of the samples was injected for analysis
Analytical Conditions
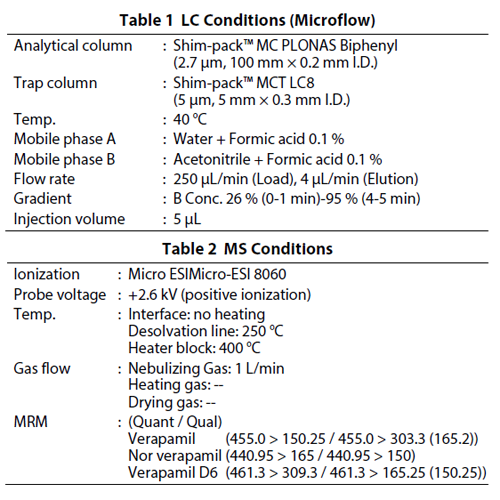
Table 1 and Table 2 show the conditions of HPLC using the Nexera Mikros and MS, respectively. Sample loading in the trap column was carried out using water/acetonitrile = 98/2 containing 0.1 % formic acid, and the analysis was conducted by gradient separation of the water and acetonitrile containing 0.1 % formic acid. During the analysis, 100 % acetonitrile was delivered to the trap column to wash. A comparison of microflow analysis and semi-microflow analysis was also carried out using the same device configuration.
Evaluation of Signal Intensity in Microflow Analysis
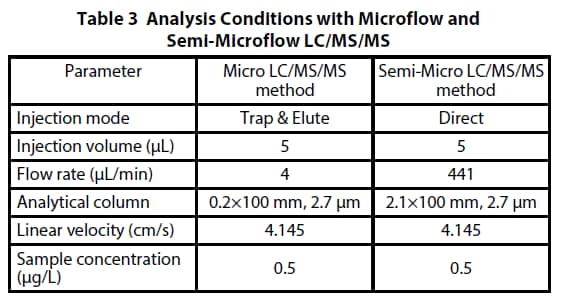
The effect of microflow analysis on the signal intensity of the target compound was evaluated using the Verapamil and Nor- Verapamil spiked plasma (lowest concentration calibration point, 0.5 μg/L). The sample injection volume and the linear velocity in the columns were adjusted to be the same, and the signal intensities with the microflow and semi-microflow were compared. A Micro-ESI 8060 microflow ionization unit was used as the ionization unit under the microflow condition, and a standard ESI ionization unit was used with the semimicroflow. Table 3 shows analysis conditions.
The product described in this document has not been approved or certified as a pharmaceutical device under the Pharmaceutical and Medical Device Act of Japan. It cannot be used for the purpose of medical examination and treatment or related procedures. In comparison with the semi-microflow analysis, the signal intensity for Verapamil increased by 4.5 times or more and that of Nor-Verapamil increased by 3.5 times or more when the microflow was used (Fig. 4), confirming that sensitivity can be enhanced with the same sample volume by using the microflow method.
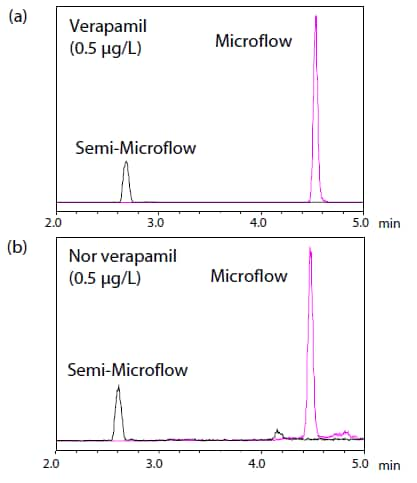
Fig. 4 Comparison of Signal Intensities of (a) Verapamil and
(b) Nor-Verapamil in Microflow and Semi-Microflow LC/MS/MS
(Spiked Plasma Sample at 0.5 μg/L)