Tm Analysis System - Features
Tm Analysis System
Reliable Data Integrity
System Configuration
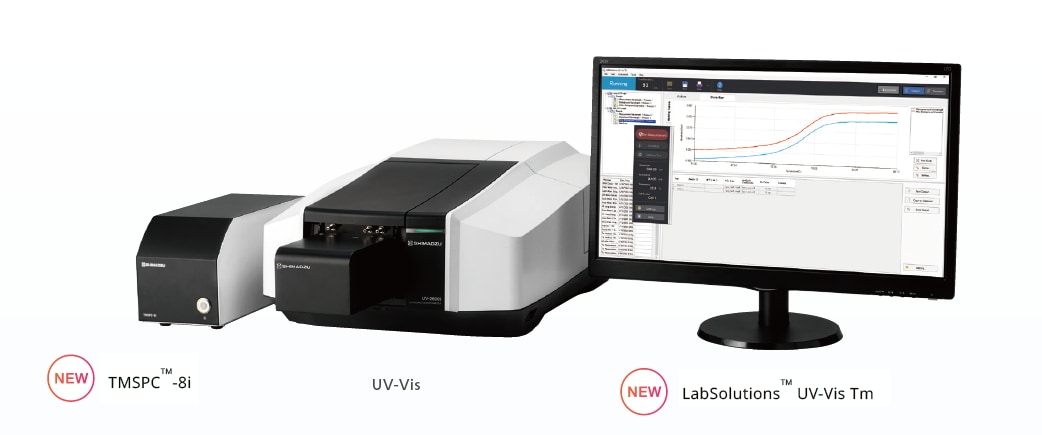
Tm analysis system consists of the following.
- UV-Vis Spectrophotometer
- TMSPCTM-8i 8-cell thermoelectrically temperature controlled cell holder
- LabSolutions UV-Vis Tm software
Data Integrity
Tm analysis systems comprise a spectrophotometer, TMSPC-8i 8-cell thermoelectrically temperature-controlled cell holder, and LabSolutions UV-Vis Tm software. They can automatically determine Tm values based on melting curve measurements using the average method or derivative method. LabSolutions UV-Vis Tm can provide the industry’s highest data integrity levels when linked to a LabSolutions DB/CS system, which has an extensive track record from use with LC, GC, and many other analytical instruments.
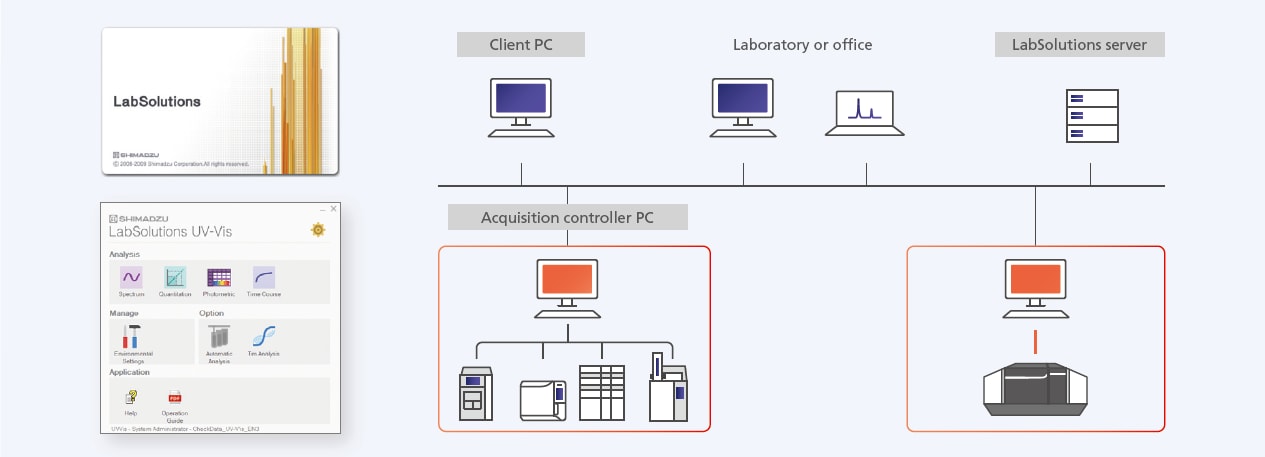
Note: LabSolutions DB UV-Vis: This is a stand-alone database management system that analysis software on a single PC.
LabSolutions CS system: A server, client, and acquisition controller are connected on the network. The data of all devices are centrally managed by the database built on the server. User and permission management is centrally managed with this system.
Functionality for Satisfying Various Needs
8-Cell Micro Multi-Cell
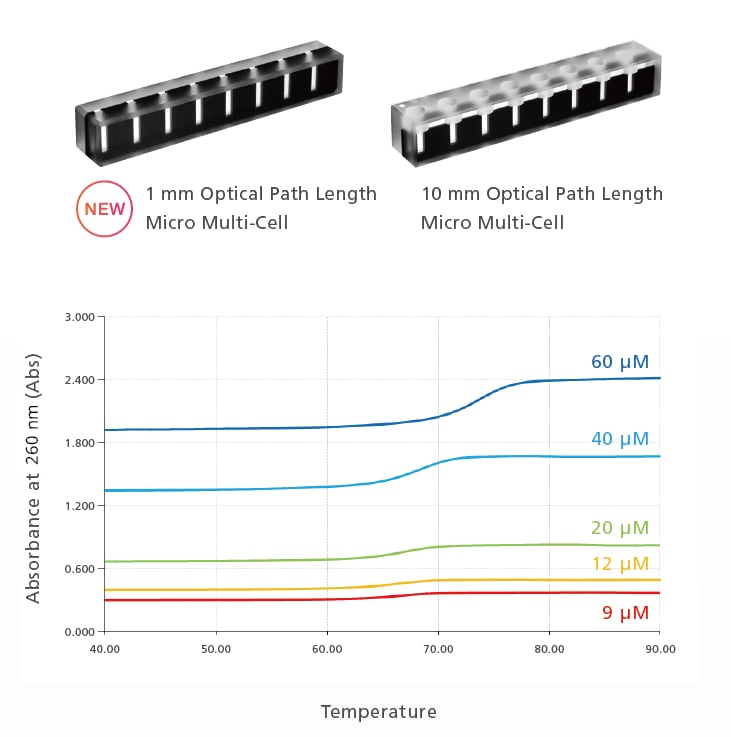
Melting Curve of Nucleic Acid (M13 Primer)
(Using Micro Multi-Cell with 1 mm Optical Path Length)
This micro multi-cell can be used to measure eight samples at the same time using the same measurement conditions.
In addition to previous micro multi-cell models with a 10 mm optical path length (with a 100 μL minimum sample volume) for satisfying high-sensitivity measurement needs, a new model with a 1 mm optical path length (with a 10 μL minimum sample volume) for measuring micro-quantities of expensive samples has been added to the lineup. Cells with a 1 mm optical path length can result in sample evaporation problems, but a new sealing method*, which suppresses the evaporation of samples by sealing the top side of the cell, enables reliable measurement of samples with high melting temperatures.
*The sealing method was supported by Professor Junji Kawakami (Department of Nanobiochemistry, Faculty of Frontiers of Innovative Research in Science and Technology (FIRST), Konan University, Japan). This was supported by AMED under Grant Number JP21ae0121022, JP21ae0121023, JP21ae0121024 (Project leader: Satoshi Obika).
Real-Time Transfer Function and Thermodynamic Parameter Analysis
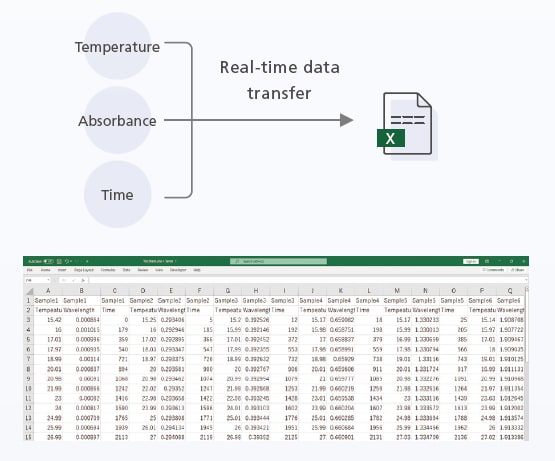
LabSolutions UV-Vis Tm can transfer temperature, absorbance, and time values to an Excel® file in real-time during measurements.
By transferring Tm values obtained from samples with different concentration levels to commercial spreadsheet software, changes in Gibbs free energy values used as an index for drug activity levels or thermodynamic properties, such as entropy or enthalpy, can be analyzed easily.
Efficient Automated Workflow
![]()
Conventional Tm analysis requires multiple steps, including checking the UV-Vis spectrum, annealing, measuring the melting curve, and analyzing data, with recording and data management performed separately. In the past, the spectrum measurement, annealing, and melting curve data were discrete. LabSolutions UV -Vis Tm software supports the entire process from measurement to analysis (Tm value calculation) with a menu that is easy to understand, even for those new to Tm analysis. It achieves a seamless workflow and efficient Tm analysis by performing time-consuming annealing, correction (background wavelength and temperature blank correction), and Tm value calculation (average or derivative methods) steps automatically. In addition, measurement data and analysis values are saved as a set, and various settings and operation histories are managed by an Audit Trail Log.
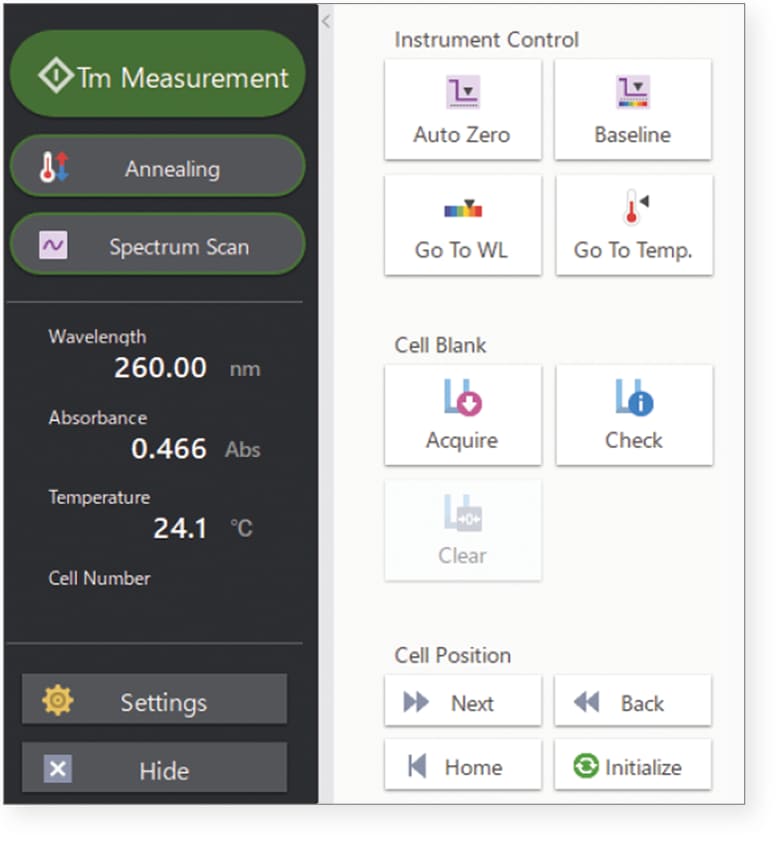
Measuring a sample spectrum
Set the sample and measure the spectrum.
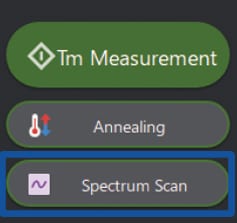
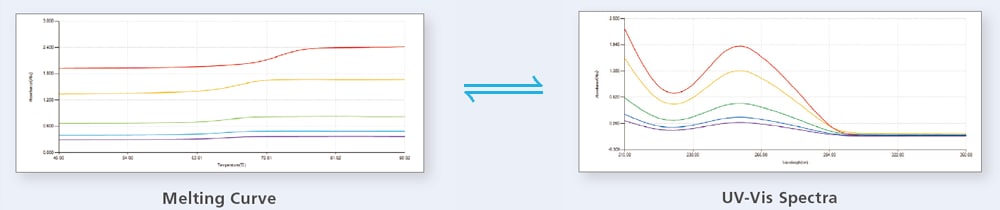
■ Spectrum data and the melting curve can be easily confirmed by switching tabs
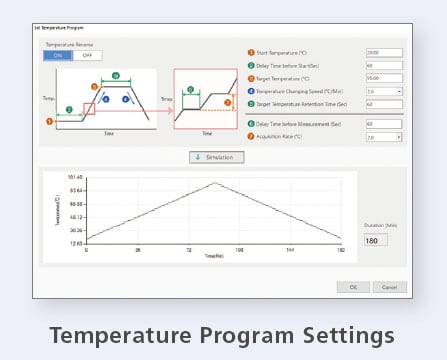
Automate annealing with simple settings
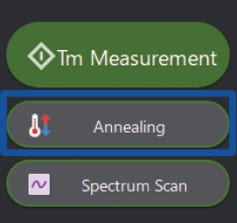
By raising and lowering the temperature of the sample, the nucleic acids are made single-stranded and then re-bonded to double-stranded. This reduces the number of binding mismatches, enabling stable analysis.
■ Automated annealing with temperature program setting
■ Automated flow reduces the risk of sample mix-ups during the transition between measurement and annealing.
■ Automatic recording of annealing and temperature settings
Easy setup and automatic Tm measurement and analysis
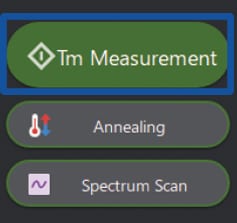
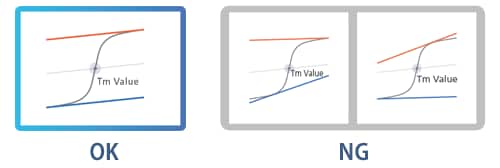
It measures the change in absorbance during the melting process of nucleic acids from double strands to single strands as the temperature rises.
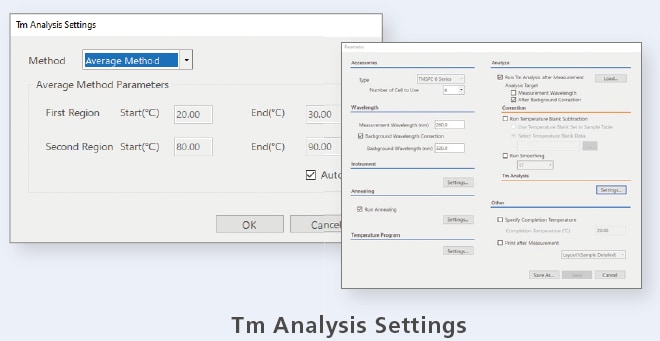
The Tm value (the melting temperature at which the mole fractions of double-stranded and single-stranded molecules are equal) is calculated by the average method, which determines a value based on the intersection of the melting curve and the median line of the tangents of the sections selected in the pre and post-transition region, or by the derivative method obtained from the maximum value of the first derivative.
■ Tm analysis supports both average and derivative methods
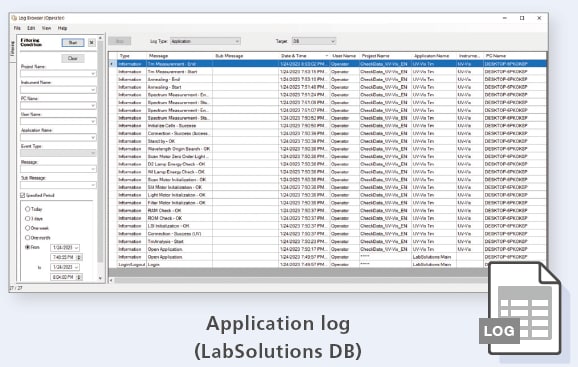
■ All application logs from measurement to analysis are automatically recorded to ensure reproducibility
■ Automatic calculation of Tm values enables analysis that eliminates the need for human intervention
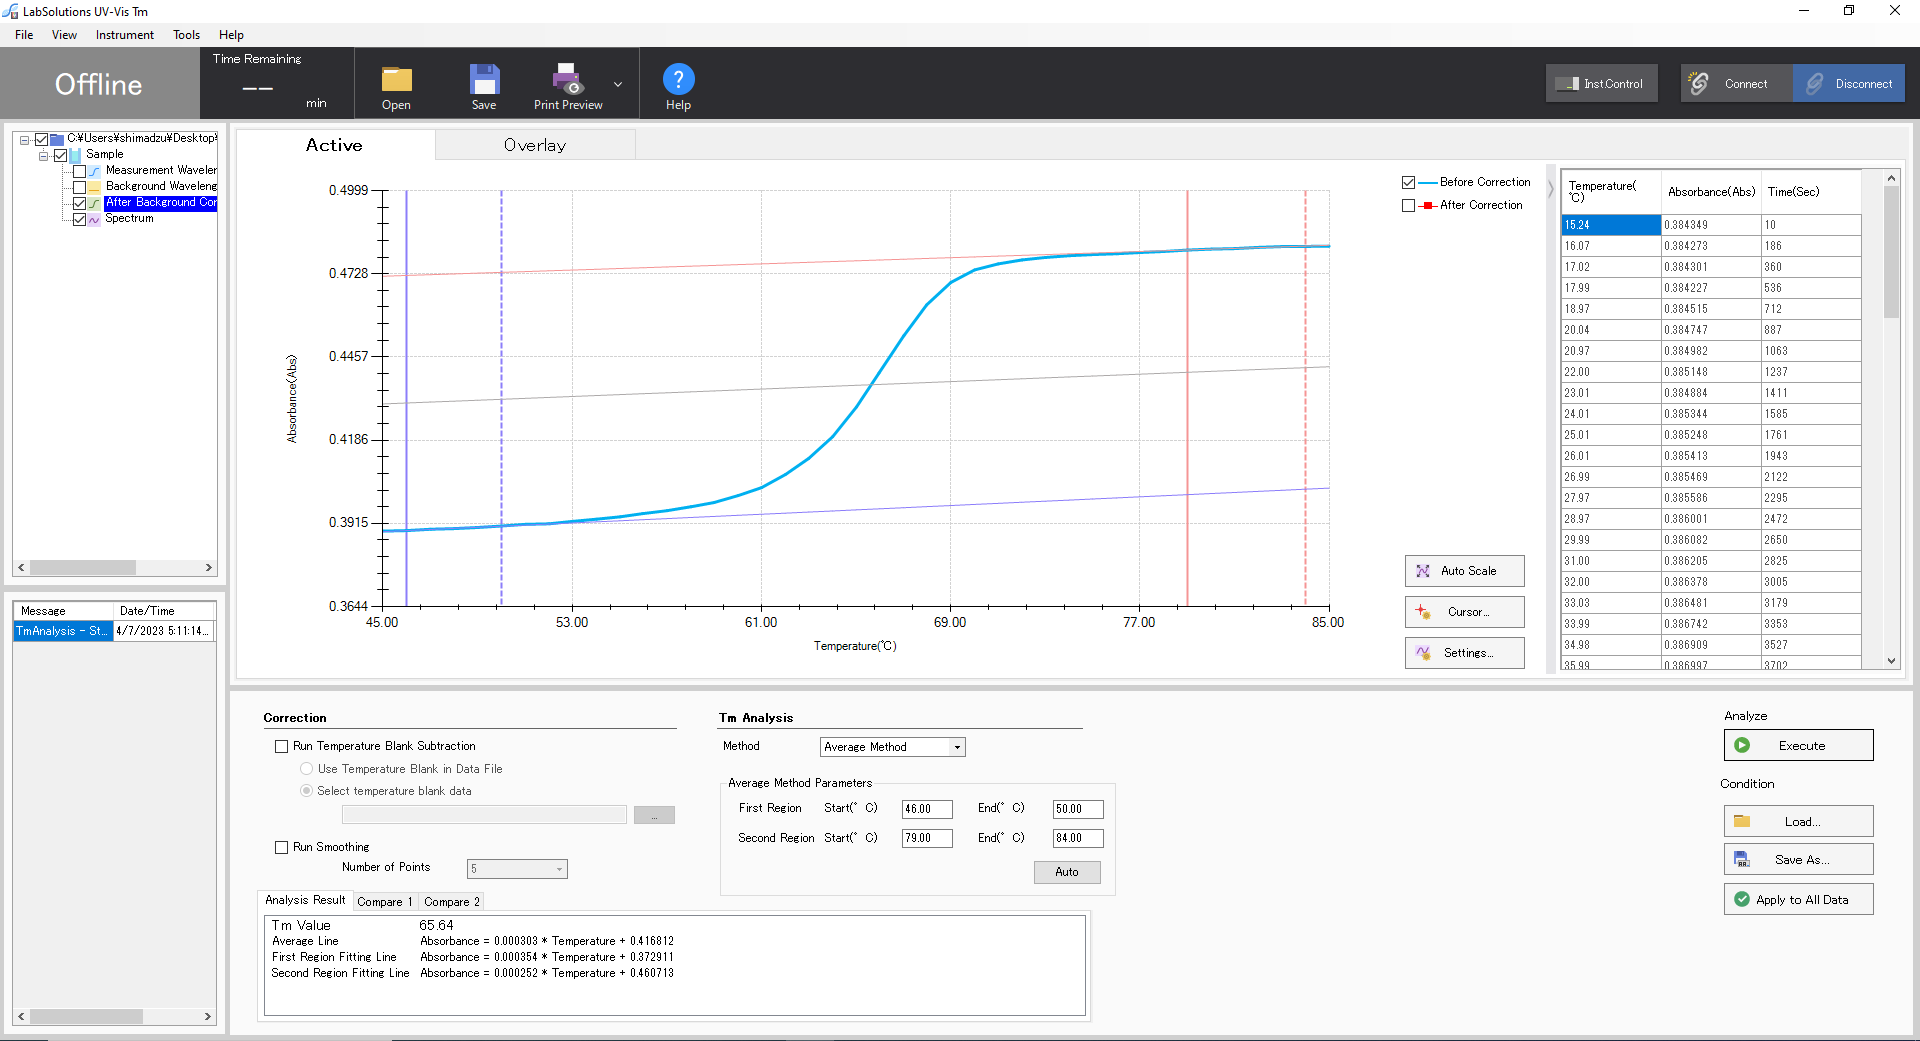
Example of Tm Analysis