LabSolutions RF - Features
Software for Spectrofluorophotometer
Quantitative Analysis, Creating and Printing Reports, Fluorescence Quantum Yield and Fluorescence Quantum Efficiency, Validation and LED Indicators, Video
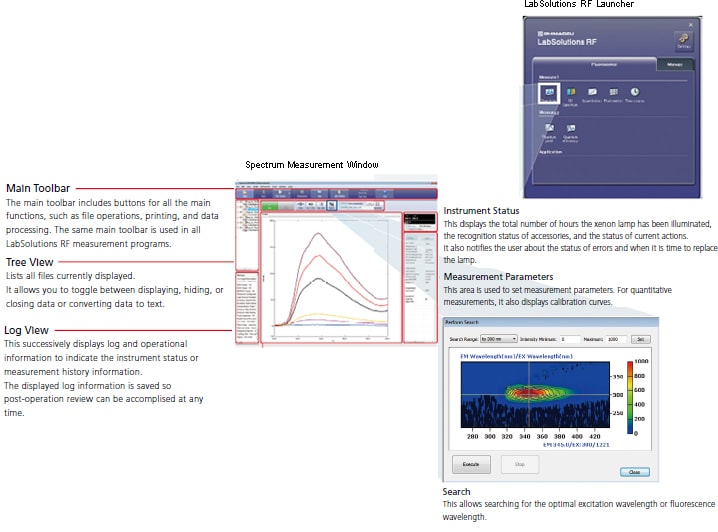
All functions can be launched from the LabSolutions RF launcher.
Relevant functions for each measurement action, such as spectral measurements and quantitative measurements, are organized conveniently on the LabSolutions RF launcher. That allows easy selection of the desired measurement function. In addition, frequently used Windows applications can also be added to the LabSolutions RF launcher.
* Please contact Shimadzu representative to comply with ER/ES regulations including FDA 21 CFR Part 11 and PIC/S.
Spectral Correction
Spectral correction functions are included standard,
which allows you to display spectra corrected in real time!
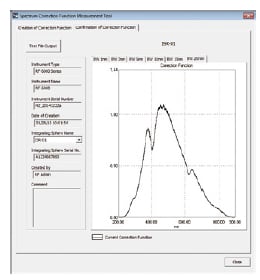
A spectral correction function for obtaining the true excitation and fluorescence spectra determined by correcting the instrument function for instrument characteristics, such as the emission characteristics of the light source and spectral characteristics of the optical system, is included standard. Because true spectra can be obtained in real time, the spectra can be easily compared to spectra measured using other instruments. The spectral correction functions preregistered in systems are determined using a calibrated standard light source and Shimadzu's proprietary correction techniques. If an integrating sphere is installed as an accessory, a function for creating spectral correction functions is included standard; this eliminates the need to install a special light source.
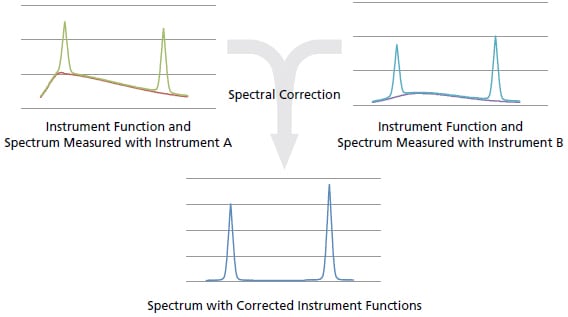
Overview of spectral correction
A certain sample had two fluorescence peaks. When that sample was measured using instruments A and B, the fluorescence peak intensity was higher for the left peak with instrument A, whereas the right peak was higher for instrument B. In reality, the spectral peak intensities and positions differed because instruments A and B each had the emission characteristics of light source and the spectral characteristics of optical system. Correcting the spectra by subtracting the difference in light source and optical system characteristics resulted in the same spectra, which reveals that the two peaks are successively larger as the wavelength increases. By comparing the spectra measured with different instruments the effects from differences in instrument characteristics cannot be ignored. Spectral correction allows you to compare data measured using different instruments.
3D Measurements
3D spectra can be measured at high speed.
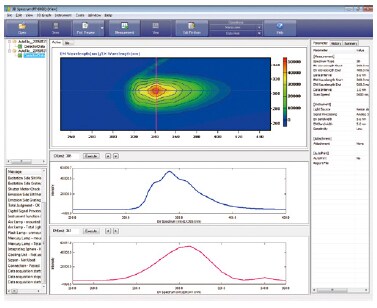
Excitation wavelength versus fluorescence wavelength 3D fluorescence spectra can be obtained by successively varying the excitation wavelength as fluorescence spectra are measured. 3D fluorescence spectra are helpful for determining the optimal excitation wavelength and fluorescence wavelength. Recently, differences in such 3D fluorescence spectral patterns (shapes) have allowed for discriminating between different types of samples or identifying the source of samples in some cases. Because the RF-6000 is able to scan samples at high speeds up to 60,000 nm/min, 3D fluorescence spectra can be obtained quickly, even for 3D measurements of the maximum wavelength range.
Quantitative Analysis
High-sensitivity quantitative measurements can be performed easily.
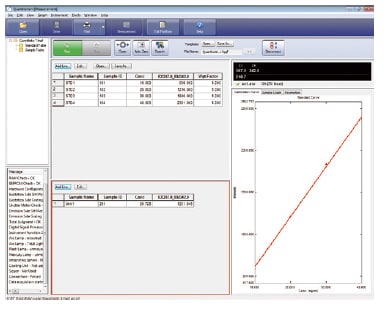
Calibration curves are prepared from fluorescence spectra of samples with known concentrations, based on peak intensity and peak area values.
As a result, the concentration of samples without known concentrations can be calculated from the fluorescence spectral results based on the calibration curve that was created. These calculated concentration values can then be used in various formulas to perform additional calculations. They can also be used for pass/fail decisions based on a speciˆed threshold value.
Creating and Printing Reports
Report formats can be created easily.
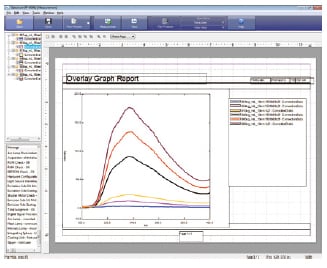
Printed reports can be freely prepared by simply dragging the desired content to the desired layout. This allows you reviewing the layout before printing, with content dragged into place, without using the print preview function.
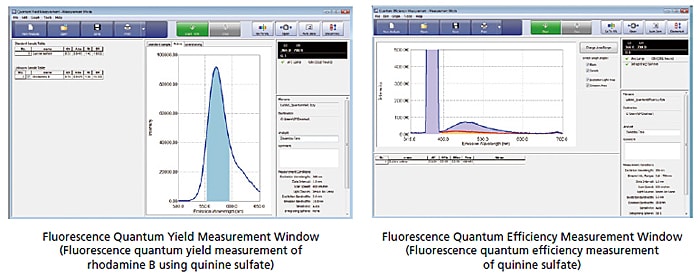
Fluorescence Quantum Yield and Fluorescence Quantum Efficiency
Measuring fluorescence quantum yield and fluorescence quantum efficiency is simple.
The fluorescence quantum yield can be calculated by comparing the fluorescence spectra of unknown samples with those of a standard sample with a known quantum yield. The 100 mm diameter integrating sphere unit can also be used to calculate the fluorescence quantum efficiency. The user-friendly window design allows anyone to easily measure the fluorescence quantum yield and fluorescence quantum efficiency using intuitive operations.
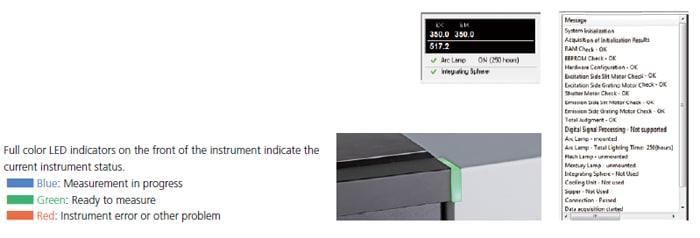
Validation and LED Indicators
Validation function allows you to diagnose performance.
Video :How to register a new spectrometer, how to collect a 2D spectrum and how to collect a 3D spectrum.
Included in this video are how to register a new spectrometer, how to collect a 2D spectrum and how to collect a 3D spectrum.