Shimadzu has long been advancing the analytical performance of HPLC systems.
HPLC is an abbreviation for High Performance Liquid Chromatography. "Chromatography" is a technique for separation, "chromatogram" is the result of chromatography, and "chromatograph" is the instrument used to conduct chromatography.
Among the various technologies developed for chromatography, devices dedicated for molecular separation called columns and high-performance pumps for delivering solvent at a stable flow rate are some of the key components of chromatographs. As related technologies became more sophisticated, the system commonly referred to as High Performance Liquid Chromatography, simply became referred to as "LC". Nowadays, Ultra High Performance Liquid Chromatography (UHPLC), capable of high-speed analysis, has also become more wide-spread.
Only compounds dissolved in solvents can be analyzed with HPLC. HPLC separates compounds dissolved in a liquid sample and allows qualitative and quantitative analysis of what components and how much of each component are contained in the sample.
Fig.1 shows a basic overview of the HPLC process. The solvent used to separate components in a liquid sample for HPLC analysis is called the mobile phase. The mobile phase is delivered to a separation column, otherwise known as the stationary phase, and then to the detector at a stable flow rate controlled by the solvent delivery pump. A certain amount of sample is injected into the column and the compounds contained in the sample are separated. The compounds separated in the column are detected by a detector downstream of the column and each compound is identified and quantified.
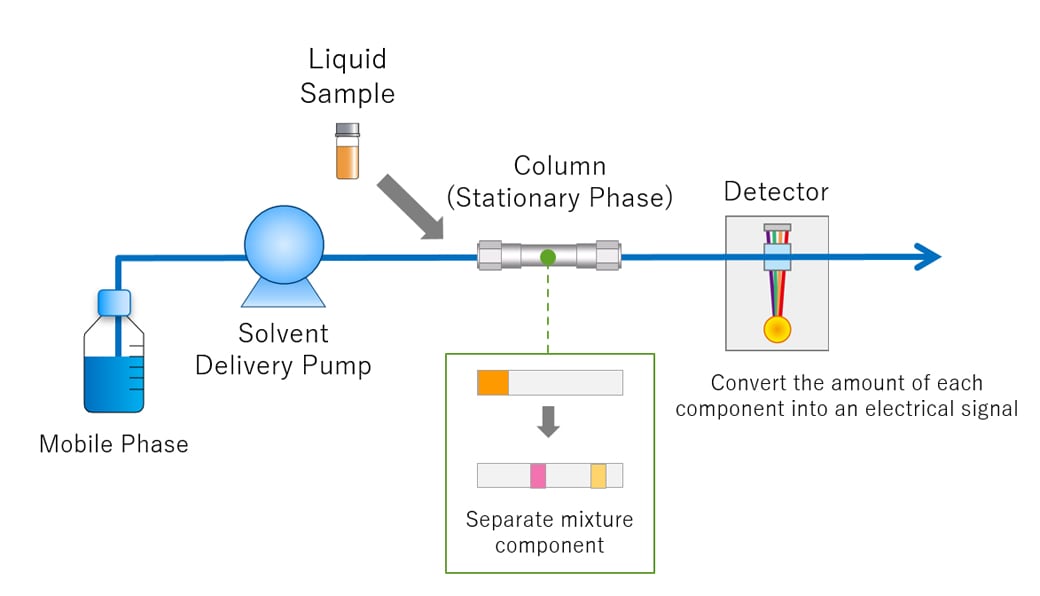
Fig.1 Overview of HPLC
The “Basic Overview of the HPLC process"(As shown in Fig.1) and its mechanisms have now been covered. Going into more detail, HPLC consists of a variety of components, including a solvent delivery pump, a degassing unit, a sample injector, a column oven, a detector, and a data processor. Fig.2 shows the HPLC flow diagram and the role of each component.
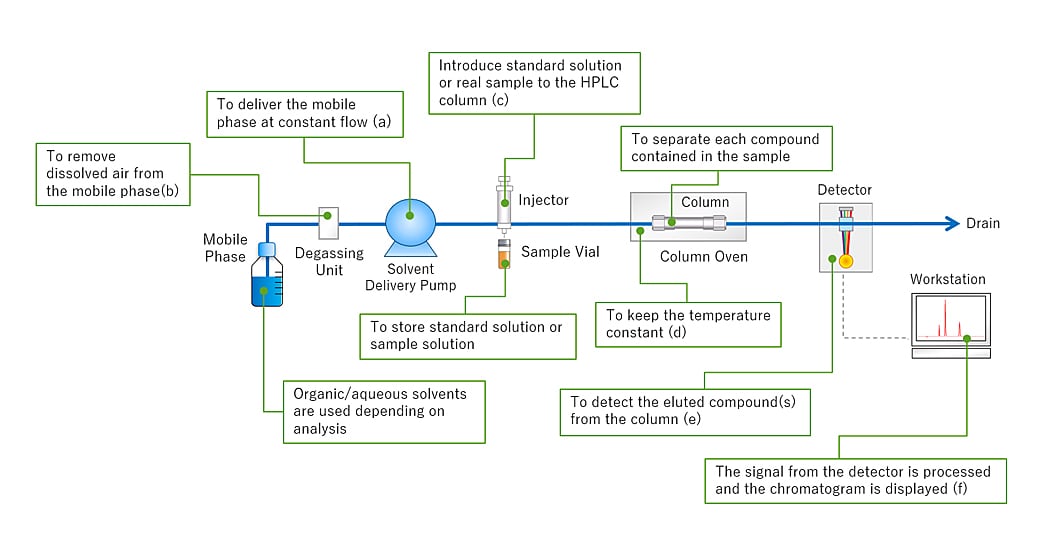
Fig.2 HPLC Flow Diagram
As for HPLC, the pump delivers the mobile phase at a controlled flow rate(a). Air can easily dissolve in the mobile phase under the standard atmospheric pressure in which we live in. If the mobile phase contains air bubbles and enters the delivery pump, troubles such as flow rate fluctuations and baseline noise/drift may occur. The degassing unit helps prevent this issue by removing air bubbles in the mobile phase(b). After the dissolved air has been removed, the mobile phase is delivered to the column. The sample injector then introduces a standard solution or sample solution into the mobile phase (c). Temperature fluctuations can affect the separation of compounds in the column. The column is placed in a column oven to keep the temperature constant(d). Compounds eluted from the column are detected by a detector which is placed downstream of the column(e). A workstation processes the signal from the detector to obtain a chromatogram to identify and quantify the compounds(f).
HPLC can separate and detect each compound by the difference of each compound's speed through the column. Fig.3 shows an example of HPLC separation.
There are two phases for HPLC: the mobile phase and the stationary phase. The mobile phase is the liquid that dissolves the target compound. The stationary phase is the part of a column that interacts with the target compound.
In the column, the stronger the affinity (e.g.; van der waals force) between the component and the mobile phase, the faster the component moves through the column along with the mobile phase. On the other hand, the stronger the affinity with the stationary phase, the slower it moves through the column. Fig. 3 shows an example in which the yellow component has a strong affinity with the mobile phase and moves quickly through the column, while the pink component has a strong affinity with the stationary phase and moves through slowly. The elution speed in the column depends on the affinity between the compound and the stationary phase.
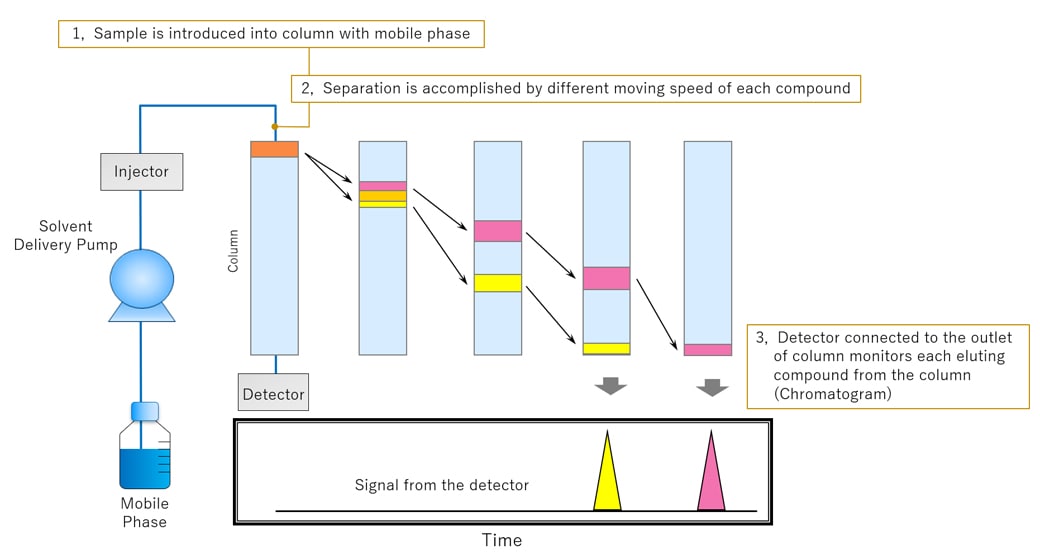
Fig.3 An Example of HPLC Separation
The word "chromatogram" means a plot obtained via chromatography. Fig.4 shows an example of a chromatogram. The chromatogram is a two-dimensional plot with the vertical axis showing concentration in terms of the detector signal intensity and the horizontal axis representing the analysis time. When no compounds are eluted from the column, a line parallel to the horizontal axis is plotted. This is called the baseline. The detector responds based on the concentration of the target compound in the elution band. The obtained plot is more like the shape of a bell rather than a triangle. This shape is called a “peak”.
Retention time (tR) is the time interval between sample injection point and the apex of the peak. The required time for non-retained compounds (compounds with no interaction for the stationary phase) to go from the injector to the detector is called the dead time (t0).
The peak height (h) is the vertical distance between a peak's apex and the baseline, and the peak area (A) colored in light blue is the area enclosed by the peak and baseline. These results will be used for the qualitative and quantitative analysis of a sample's components.
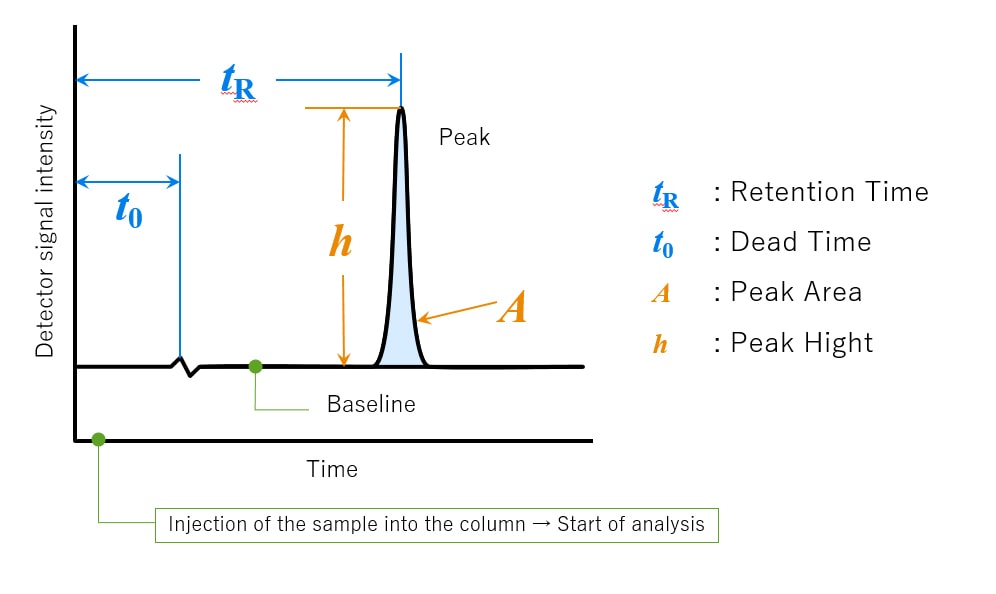
Fig.4 Chromatogram and Related Terms
Shimadzu has long been advancing the analytical performance of HPLC systems.
Amid increasing calls for improved work efficiency and a more flexible working style, ideas of LC analysis are changing.