Gradient Baseline for Water/Acetonitrile Containing TFA
Gradient elution (GE) with water/acetonitrile containing trifluoroacetic acid (TFA) is commonly used for the analysis or fractioning of peptides and proteins. This can result in a bulge in the baseline and ghost peaks, making it difficult to determine how to perform data processing. We will investigate this issue on this page.
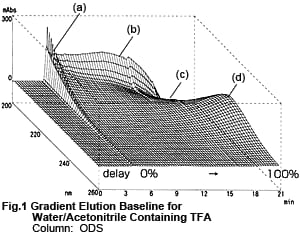
Fig. 1 shows a 3D chromatogram obtained by gradient elution with Liquid A and Liquid B, with the concentration of Liquid B increased from 0 to 100 %. Liquid A is a 0.01 M aqueous solution of TFA and Liquid B is a 0.01 M acetonitrile solution of TFA. The peak (a) near the time when Liquid B first reaches the detector, the bulge (b) and depression (c) near 200 nm, and the bulge (d) near 225 nm due to the increase in Liquid B are clearly shown.
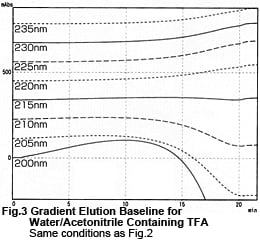
Fig. 2 shows what we get by removing the column and performing gradient elution using the tubing only. The major difference is that peak (a) in Fig. 1 has disappeared. This indicates that the peak resulted from elution of TFA or impurities in the mobile phase that were retained in the column. Conversely, bulges (b), (c), and (d) were deemed to be inherent to the method. Fig. 3 shows the data from Fig. 2 as chromatograms. It shows the smallest baseline fluctuations around 215 nm. At low wavelengths, the curves bulge before dropping. At long wavelengths, the concave curves gradually rise.
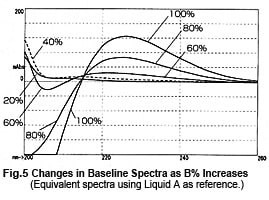
So, it might appear that measurements can be performed safely near 215 nm, but this is not necessarily the case. Fig. 4 shows chromatograms of measurements at 215 nm while changing the wavelength bandwidth. It shows that the baseline fluctuates significantly as the wavelength bandwidth expands. This effect seems to occur due to a shift toward the short-wavelength side. Near 215 nm, the changes in absorbance toward the short-wavelength end are greater than the changes in absorbance toward the long-wavelength end (Fig. 5). As a single-wavelength UV-VIS detector normally offers a wavelength bandwidth of approximately 8 nm, care is required when performing gradient elution at 50 % or more Liquid B.
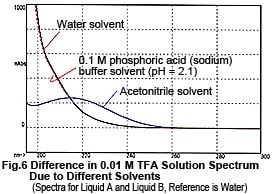
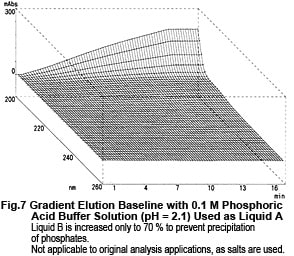
Now, let's take a look at the spectra of Liquid A and Liquid B. Although they both contain the same concentration of TFA (0.01 M), the spectra differ considerably, as shown n Fig. 6. So, the baseline fluctuations during gradient elution described above do not result from the proportion of mixing of Liquid A and Liquid B, rather due to the changes in their spectra. So, why does the absorption spectrum change as the proportion of acetonitrile increases? Possible reasons are (1) it suppresses the dissociation of TFA and (2) a mutual interaction between TFA and acetonitrile. As an experiment, we maintained the dissociation state of the TFA as constant as possible. Instead of water, we used 0.1 M phosphoric acid (sodium) buffer solution (pH 2.1) containing dissolved TFA as the solvent for Liquid A. (As shown in Fig. 6, the spectrum of this buffer solution is almost identical to water). Then performed gradient elution, increasing the concentration of Liquid B from 0 to 70 %. No irregular fluctuations of the baseline could be observed, as shown in Fig. 7. Consequently, the changes in the spectra are thought to be caused by the dissociation of TFA. (Increasing the percentage of acetonitrile shifts the equilibrium below to the left.)
Using another organic acid, such as acetic acid, instead of TFA results in similar baseline fluctuations. So, before jumping to a conclusion that a problem has occurred, check if the fluctuations are appropriate or if issues have occurred with qualification or quantification.
Reference: G. Winkler, et al., J. Chromatogr., 347 (1985) 83-88.