3-1) Solvent Delivery Problems Due to Bubbles Generated Inside the Mobile Phase Bottle
Problems with Formation of Bubbles in Flow Lines
Now let us reconsider problems due to bubble formation in flow lines, introduced in section 1, based on the mechanism described in section 2.
Solvent Delivery Problems Due to Bubbles Generated Inside the Mobile Phase Bottle
If bubbles form in the mobile phase bottle, it indicates the mobile phase has become supersaturated with dissolved air. For example, this could be caused by the following:
(1)Increase in Liquid Temperature This can occur when using cold solvent taken from storage and immediately placed in the mobile phase bottle or when the mobile phase was set up in the morning, but the room temperature increased by mid-day.
(2)Inadequate Mixing of Solvent Mixtures In particular, the endothermic reaction when mixing water and acetonitrile can decrease the solution temperature. Even if the solution was, therefore, thoroughly mixed to remove any supersaturated air, bubbles can still occur if it is heated by the room temperature and its temperature increases.
If these bubbles are sucked via the suction filter and into the pump head, solvent will no longer be delivered properly. First, when bubbles are suctioned up, the somewhat lower pressure inside the pump head causes the bubbles to expand (Figure 7). When this occurs, the plunger meters the volume of solvent together with the volume of the expanded bubbles. Next, when solvent is ejected, the high pressure inside the head shrinks the bubbles. This means less than the normal amount of mobile phase is delivered. In this way, if an unrestricted flow of bubbles are allowed to flow through the head, the amount of mobile phase being delivered will be unrestricted as well (poor solvent delivery accuracy and precision). The presence of this phenomenon can be determined by monitoring (Figure 8) the discharge pressure profile of the solvent delivery pump.
If this type of problem occurs, variability will tend to increase for the retention time and area values of peaks (Figure 9) and the analysis will provide inadequate reliability.
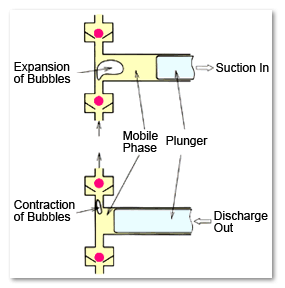
Fig. 7 Illustration of Bubbles in the Pump Head
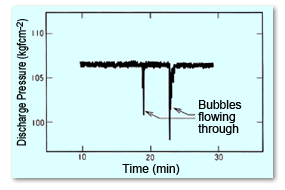
Fig. 8 Change in Discharge Pressure Profile
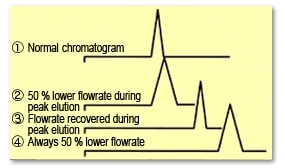
Fig. 9 Example of Change in Chromatograms Due to Uncontrolled Delivery Rate