Abnormal Peak Shapes
Have you ever encountered a situation during HPLC analysis when you thought: "something is wrong with these peak shapes."? Abnormal peak shapes are a common problem when conducting routine analysis work. Peak abnormalities that are clearly noticeable in chromatograms include peak broadening (including extreme tailing or leading edges), shoulder peaks, and split peaks, as illustrated in Figure 1.
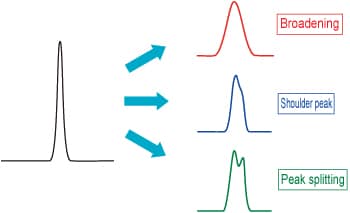
Figure 1: Examples of Abnormal Peak Shapes
If any of those peak abnormalities appear in chromatograms, they could be caused by the factors indicated in Figure 2. This article discusses the main causes of abnormal peak shapes.
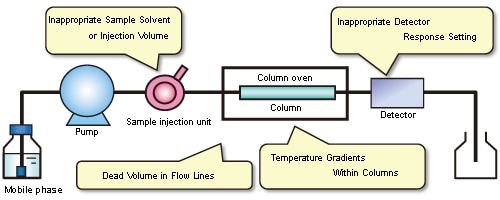
Figure 2: Major Causes of Abnormal Peak Shapes
Column Deterioration
- If peak shapes start resembling those in Figure 1 even though analysis is being performed in the usual manner, the most probable cause is column deterioration (including contamination). If a guard column is installed before the analytical column, check the peak shape after removing the guard column. If the peaks return to normal, the problem is with the guard column.
- Column deterioration can occur due to a change in the column packing status, an accumulation of contaminant components, microparticle blockage, desorption from the solid phase, or other factors. The packing status can change from exposure to long-term pressure loads or deterioration of the base packing material (dissolution of silica gel, for example). In many cases, a slight gap develops in the packing material at the column inlet, which can cause shoulder peaks or split peaks. Microparticle blockage (from sample solutions, mobile phases, pumps, sample injection units, etc.) or accumulations of contaminant components can occur in the filters installed on the inlet side of columns or in packing material near the inlet. Sample component adsorption to contaminant accumulations or microparticles inhibiting the flow of sample components can change peak shapes. Desorption from the solid phase can not only change the peak shape, but also shorten retention times.
- If column deterioration is suspected, rinse the column. For instructions on column rinsing methods, refer to the column instruction manual. If adequate results cannot be achieved after rinsing, columns can sometimes be backflushed. (Rinse solution is pumped in the opposite direction at a low flowrate through the column, from the column outlet end.) However, be sure to check the column instruction manual or other source to confirm that the column can be backflushed. If rinsing or backflushing does not resolve the problem, the column has reached its service life.
Inappropriate Sample Solvent or Injection Volume
- This refers to cases where abnormal peak shapes occur after changing the sample solvent composition or injection volume, due to pretreatment or the concentration of substance being analyzed. In such cases, first confirm the peak shape after using the previous sample solvent and injection volume.
- Examples of the effects of sample solvent composition on peak shape are shown in Figure 3. Chromatograms (a) and (b) are results from using the identical instrument to analyze standard mixture solutions prepared using two different types of sample solvents.
Though not noticeable when viewing chromatogram (b) alone, a comparison with chromatogram (a) clearly shows peak broadening in chromatogram (b). The same organic solvent ratio is used for the sample solvent in (a) (water/acetonitrile = 3/1) as for the mobile phase (citrate buffer solution/acetonitrile = 3/1), but only acetonitrile, which is a strong solvent for the reversed phase mode, was used as the sample solvent in (b). This example shows how strong solvents can affect peak shape if the ratio of strong solvent in the sample solvent becomes high.
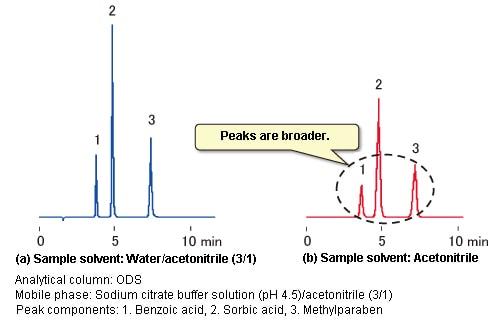
Figure 3: Effects of Sample Solvents on Peak Shape
- The sample injection volume is related to broadening of the sample zone in the first stage of column separation. Therefore, increasing the injection volume can result in peak broadening. In particular, the higher the ratio of strong solvent in the sample solvent, the greater the effects.
Dead Volume in Flow Lines
- If peaks broaden after using different tubing (but with the same internal diameter), it may be due to dead volume at the tubing connections (between the sample injection unit, column, and detector) through which samples pass. An example of dead volume is shown in Figure 4.
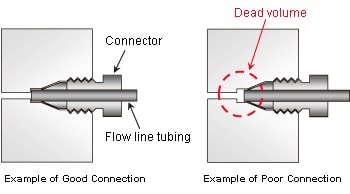
Figure 4: Dead Volume in Flow Line Connection
- The length of tubing protruding from the connector differs depending on the manufacturer. It is especially important for column connections. If new tubing is installed, insert the tubing all the way into the joint and press it against the far side as the connector is tightened.
Temperature Gradients Within Columns
- If using high flowrates, high column temperatures, or a column with a large internal diameter, for example, and the mobile phase flows through the column without being sufficiently heated, a temperature gradient can form in the cross-sectional direction of the column. (The temperature is lower at the center of the column than near the column inner walls.) That can cause peak broadening.
- Temperature gradient effects can be suppressed by lengthening the tubing (stainless steel) between the sample injection unit and column to preheat the mobile phase in the column oven. However, that can also cause peak broadening in the preheat tubing, which requires optimizing the internal diameter and length.
Inappropriate Detector Response Setting
- In general, noise can be reduced by changing the detector response setting (also referred to as the time constant). A slower response setting can reduce noise, which is beneficial for high-sensitivity analysis, but it also results in peak broadening. Examples of the effects of response on peak shape are shown in Figure 5.
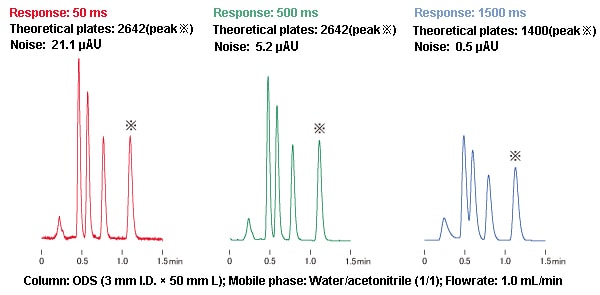
Figure 5: Effects of Response on Peak Shape
- Figure 5 shows how the sooner peaks are eluted, the more they are affected by the response setting. Therefore, as a precaution, check the response setting before starting analysis.