Tensile Tests of Various Plastic Materials (1)
Introduction
Resin materials referred to as "plastics" are defined as "artificially synthesized polymers having plasticity." Plastic products with a great variety of characteristics are produced and adopted widely in our surroundings.
Plastics are categorized roughly into "thermoplastic resins" and "thermosetting resins" depending on their processability characteristics. This Application News focuses on the former "thermoplastic resins", elucidating the features and differences among 4 universally used types of plastics, namely polyethylene (PE), polypropylene (PP), polyvinylchloride (PVC) and polycarbonate (PC), based on their tensile strength properties.
Testing Apparatus and Specimens
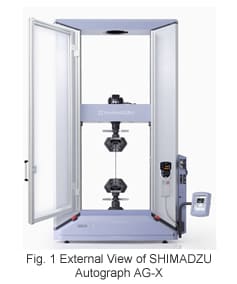
The apparatus used for this evaluation was the Shimadzu Precision Universal Tester Autograph AG-X Series (typical system is shown in image of Fig. 1), equipped with an extensometer (SSG-50-10) for conducting elongation measurement. The test specimens consisted of 5 pieces each of the 4 types of plastic materials mentioned above.
Test Conditions
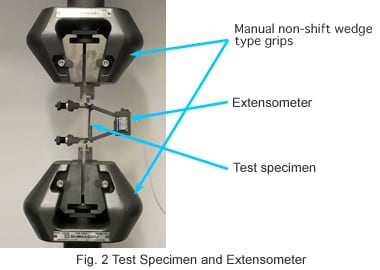
Each of the plastic specimens was gripped using Manual non-shift wedge type grips, and elongation measurement was conducted using an extensometer at a 1 mm/min load speed over the elastic region. The extensometer was then removed and testing was conducted at a load speed of 50 mm/min until specimen breakage occurred. (The test method conforms to the JIS K7161 tensile test method, which is widely used for the main parts of plastics.)
The load process data, which consisted of test force, elongation (while using the extensometer) and stroke data, were measured and recorded. Fig. 2 shows the state of the mounted test specimen with the extensometer attached.
Test Results
Fig. 3 to Fig. 6 show the actual tensile test results for the 4 plastic specimens as a relationship between stress (nominal value) and strain (calculated from the elongation as measured using extensometer, and testing machine cross head travel = stroke following removal of the extensometer).
To facilitate viewing and interpretation of the test result graphs for each of the 5 test specimens, the zero points were shifted by equal amounts.
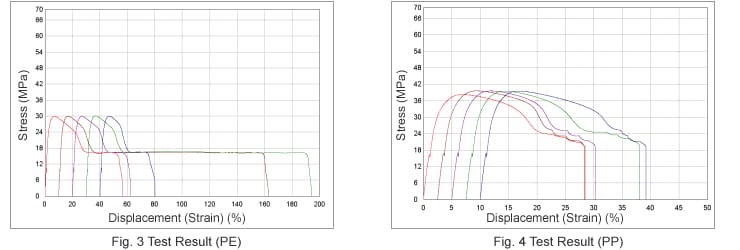
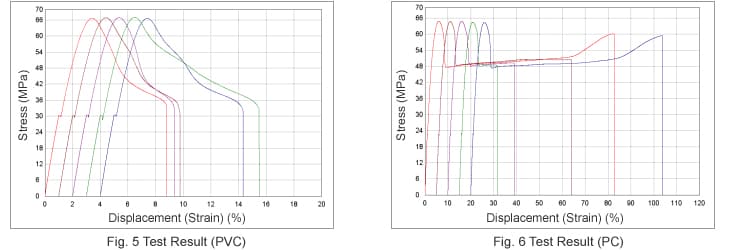
Although the diagram patterns in the results show a variation in elongation at breakage among each of the specimens, the tensile strength (maximum stress) repeatability is good. In addition, the differences in material characteristics are clearly evident. In the PE and PC graphs, necking occurs during test force reduction following the point of maximum stress, and there is a considerable amount elongation from that point up to the breaking point.
(In the PP and PVC graphs, the discontinuity in the regions of elasticity corresponds to the temporary stopping of the load when detaching the extensometer, and the change of speed from that point.)
For reference, a typical test result for each property with respect to each of the specimens was selected and summarized in Table 1.
Table 1 Test Results
|
Specimen ID |
Elasticity (MPa) |
Tensile Strength (MPa) |
Strain with respect |
Elongation at Break (%) |
|
PE |
1460 |
29.9 |
6.93 |
56.5 |
|
PP |
1940 |
38.2 |
6.84 |
28.4 |
|
PVC |
3240 |
66.6 |
3.43 |
8.75 |
|
PC |
2410 |
64.9 |
5.97 |
82.7 |
From the above results, it is interesting to learn that each of these materials show particular characteristics, even though they are all plastics. It is therefore understandable that a testing apparatus provides an effective means for evaluating the individual characteristics quantitatively.
* Please be advised that data obtained before the implementation of the current Weights and Measures Law may be presented in terms of gravimetric unit.