Static Tensile Test of Single Fibers Selection of the Best Fitted Grips and Testing Method for Autograph (IV)
Textiles and fabrics are made of yarn, which in turn consists of single fibers.
Tensile tests of fibers, including synthetic fibers and carbon fibers, often don't yield reliable data for the appropriate evaluation of the physical strength of the fiber. The fibers are often too thin to observe and much too delicate to handle when placing them in grips.
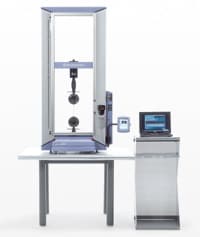
In view of a rush of development of new materials and a growing need for strength evaluation tests, we wish to introduce an example of a simple method for tensile strength tests on single fibers, using the Shimadzu Universal Testing Machine AUTOGRAPH.
This method is based on JIS-L1015 and R-7601.
Test pieces
| Material | : | Nitric fiber and chemical fiber yarn for underwear |
| Shape | : | in a form of yarn, 10〜15μm |
Testing conditions
| Testing machine | : | Shimadzu AUTOGRAPH |
| Capacity of load cell | : | 10N |
| Testing speed | : | 0.5mm/min., 200mm/min. |
Best fitted grips
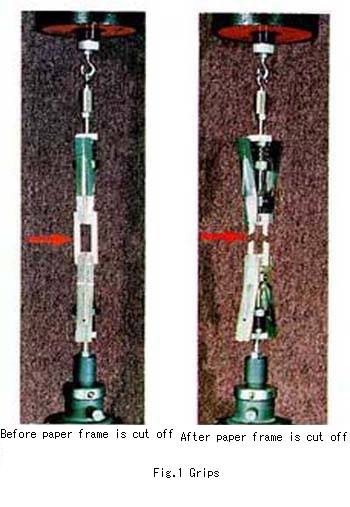
| Type | : | Clip type flat face grips (See Fig.1) |
| Capacity | : | 10N |
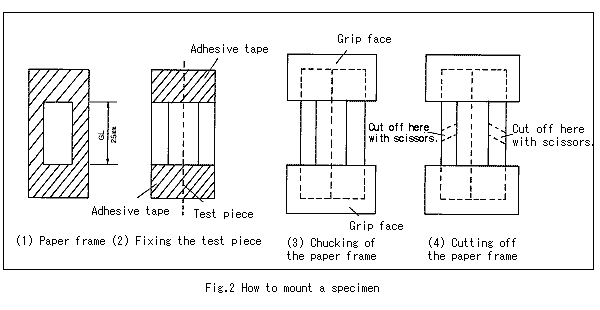
| Paper frame for attaching a test piece | : | See Fig.2 |
Attaching a test piece onto grips
Fix a test piece at both ends onto a paper frame with adhesive tape.
Cut off the paper frame with scissors referring to Fig.2 after chucking the paper frame firmly in clip-type grips. Now the test can begin.
This gripping method permits easy holding of a test piece without any shock to the test piece. A good test without any chucking cut is assured.
See Fig.2
Test result
Fig.3 shows Load-Elongation curves of nitric fiber having a short elongation range, and Fig.4 presents those of synthetic fiber, which features a wide range of elongation.
Difference of mechanical behavior between the two materials is observed in these two graphs. Tables 1 and 2 are a summary of test data showing good strength test results for each of the two test pieces, with a good reproducibility and reliability.
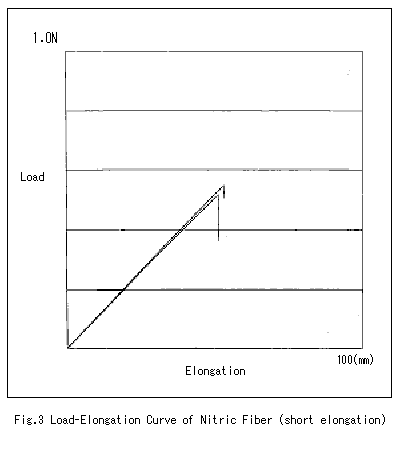
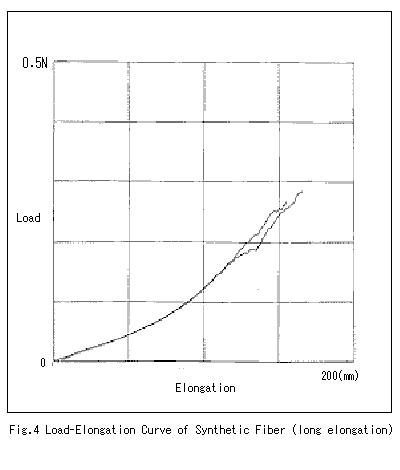
Table 1 Nitric fiber
| Specimen No. | Max. load | Elongation at max. load | ||
| N | {gf} | mm | % | |
| 1 | 0.53 | 54.6 | 0.38 | 1.52 |
| 2 | 0.53 | 54.7 | 0.53 | 2.12 |
|
3
|
0.50 | 51.7 | 0.51 | 2.05 |
| 4 | 0.53 | 58.7 | 0.44 | 1.17 |
| 5 | 0.52 | 54.0 | 0.34 | 1.38 |
Table 2 Synthetic Fiber
| Specimen No. | Max. load | Elongation at max. load | ||
| N | {gf} | mm | % | |
| 1 | 0.26 | 26.6 | 155.1 | 620.6 |
| 2 | 0.27 | 28.1 | 146.6 | 586.4 |
| 3 | 0.27 | 28.2 | 165.5 | 662.0 |
| 4 | 0.27 | 27.8 | 157.3 | 629.2 |
| 5 | 0.26 | 27.5 | 160.3 | 641.2 |


