Comprehensive Measurement of Metabolites in Gut Microbiota Using GC-MS/MS and LC-MS/MS
-
- Studies in recent years have revealed that intestinal bacteria may be beneficiary to the host by contributing to health preservation and promotion.
- Metabolomic analysis using a mass spectrometer generally employs a gas chromatograph mass spectrometer (GC-MS) or a liquid chromatography mass spectrometer (LC-MS) to comprehensively measure the metabolites (the metabolome) within a sample.
-
The human intestine harbors over 100 species of bacteria with a total of approximately 100 trillion bacterial cells, creating a complex intestinal microbiota. Studies in recent years have revealed that intestinal bacteria may be beneficiary to the host by contributing to health preservation and promotion. This has raised the attention on researches regarding the intestinal microbiota. In the field of medicine, researches are investigating the relationship of the intestinal microbiota with diseases such as colorectal cancer as well as the effects on drug efficacy and the immune system. In the field of foods, there are studies aiming to verify the health effects of lactic acids in functional foods. As a means to reveal the effects of the intestinal microbiota on the host, next-generation sequencing is used to analyze the species and distribution of bacteria in the microbiota. Another method gaining attention in recent years is metabolomic analysis using a mass spectrometer for a comprehensive analysis of the metabolites produced by the intestinal microbiota. This is because it is considered that some of the metabolites produced by the intestinal microbiota are absorbed by the intestinal tract, taken into the bloodstream, and then circulated through the entire body.
Metabolomic analysis using a mass spectrometer generally employs a gas chromatograph mass spectrometer (GC-MS) or a liquid chromatography mass spectrometer (LC-MS) to comprehensively measure the metabolites (the metabolome) within a sample. As indicated in Fig. 1, it is necessary to select either a GC-MS or an LC-MS as appropriate for the target compound and the measurement purpose. A GC-MS features excellent robustness, and although derivatization is required for hydrophilic metabolites such as amino acids, organic acids, and sugars, it can comprehensively measure several hundred compounds in one measurement. An LC-MS on the other hand does not require derivatization. Capable of efficiently measuring specific metabolites (up to 100 compounds), it is optimal for the routine measurement of specific compounds.
This article introduces a method for the comprehensive measurement of the primary metabolites in mouse feces using GC-MS/MS and LC-MS/MS.
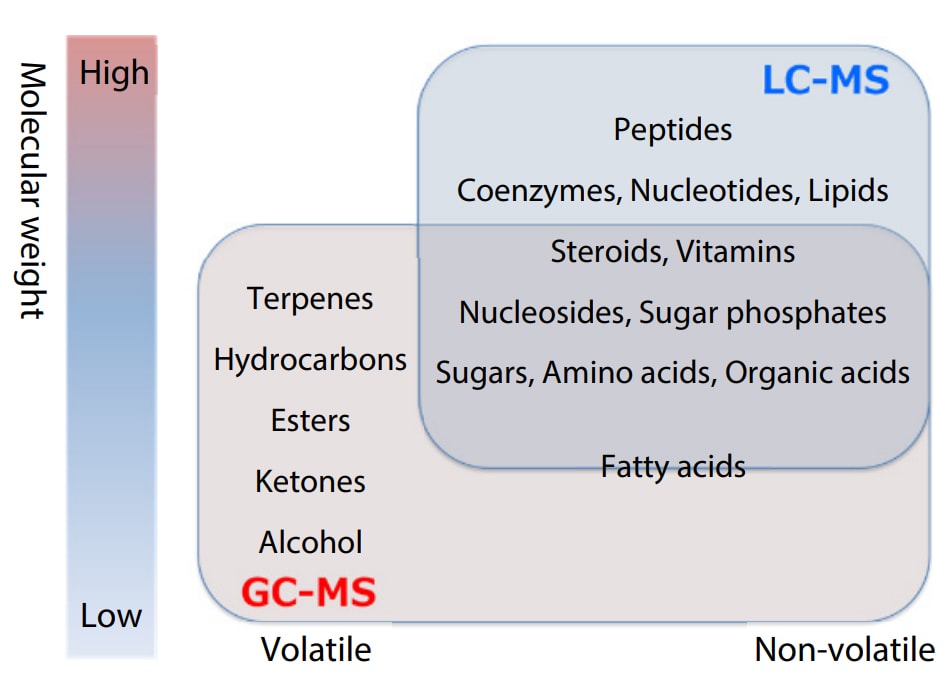
Fig. 1 Target Compounds for GC-MS and LC-MS
Pretreatment
The pretreatment procedure1 for extracting metabolites from mouse feces is shown in Fig. 2. Fresh feces were collected from male C57BL/6J mice reared in a normal environment. Taking 50 mg of the feces, we added 450 μL of phosphate-buffered saline. After mixing, the supernatant was centrifuged and subjected to ultrafiltration. For the measurement of primary metabolites using GC-MS/MS, the resulting filtrate is subjected to derivatization and is then used as the measurement sample. Details of the derivatization method are described in the "Pretreatment Procedure Handbook for Metabolites Analysis" (C146-E323). For the measurement of primary metabolites using LC-MS/MS, the measurement sample was prepared by diluting the filtrate by a factor of 10.
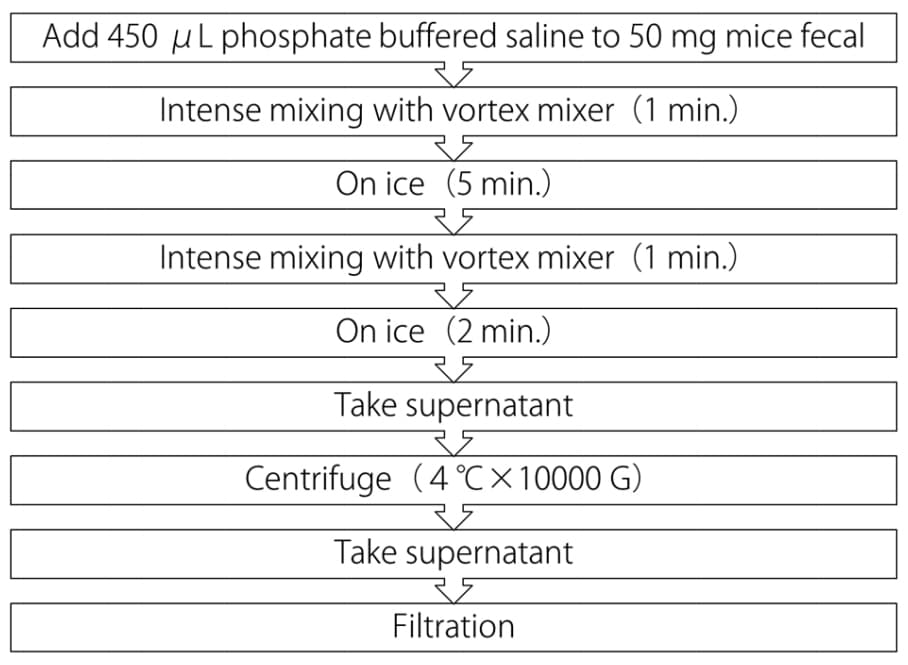
Fig. 2 Pretreatment Procedure of Mouse Feces
Analytical Conditions
GC-MS/MS analysis was done using the MRM method included in the Smart Metabolites Database™ together with the GCMS-TQ™ 8040. The Smart Metabolites Database contains the information of MRM transitions of 475 compounds, mainly of metabolites in biological samples, and allows the simultaneous measurement of 475 metabolites. Details are described in Application Data Sheet No. 104. For LC-MS/MS analysis, we used the ion pairing LC-MS/MS method and non ion-pairing LC-MS/MS method included in the LC/MS/MS Method Package for Primary Metabolites (ver. 2) together with the LCMS-8040 and the LCMS-8050. The ion pairing LC-MS/MS method makes possible the simultaneous measurement of 55 metabolites that are highly important for metabolomic analyses in the field of life sciences. This includes those of the glycolytic system, TCA cycle, pentose-phosphate pathway, amino acids and nucleotides. In addition, the non ion-pairing LC-MS/MS method enables the simultaneous measurement of 97 other metabolites, such as organic acids, that cannot be measured with the ion pairing LC-MS/MS method. Details are described in Application Data Sheet Nos. 42 and 49.
Analysis Results
The MRM chromatograms obtained from measuring mouse fecal extracts using GC-MS/MS and LC-MS/MS are shown in Fig. 3. The detected compounds and the repeatability of peak area ratios with respect to internal standard substances are listed in Table 1. GC-MS/MS analysis detected 100 compounds, mainly of short-chain fatty acids, organic acids, and sugars. Sugars are difficult to measure using LC or LC-MS/MS, but 17 compounds were detected by GC-MS/MS. The ion pairing LC-MS/MS method detected 17 compounds, mainly which are amino acids. The non ion-pairing LC-MS/MS method detected a total of 75 components, including amino acids, nucleotides, nucleosides, and organic acids of the TCA cycle. As indicated in Fig. 4, using both GC-MS/MS and LC-MS/MS is highly effective for the comprehensive measurement of metabolites in feces.
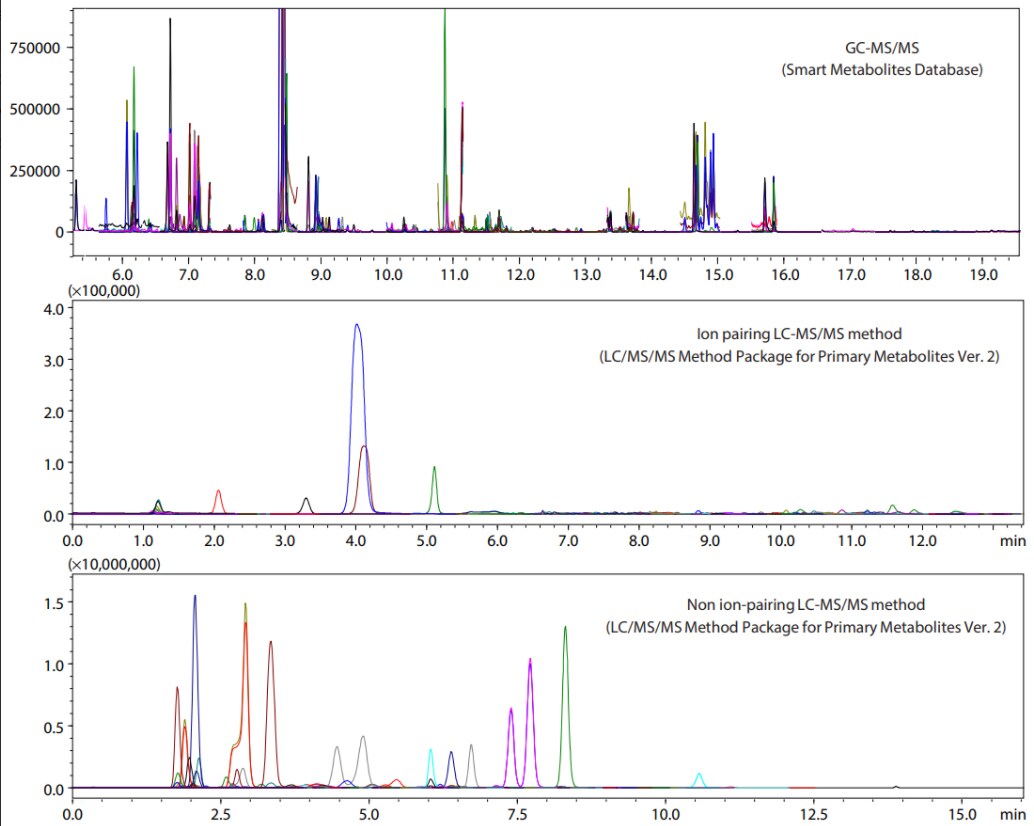
Fig. 3 MRM Chromatograms of Mouse Fecal Extracts
Table 1 Metabolites Detected from Mouse Fecal Extracts and Repeatabilities
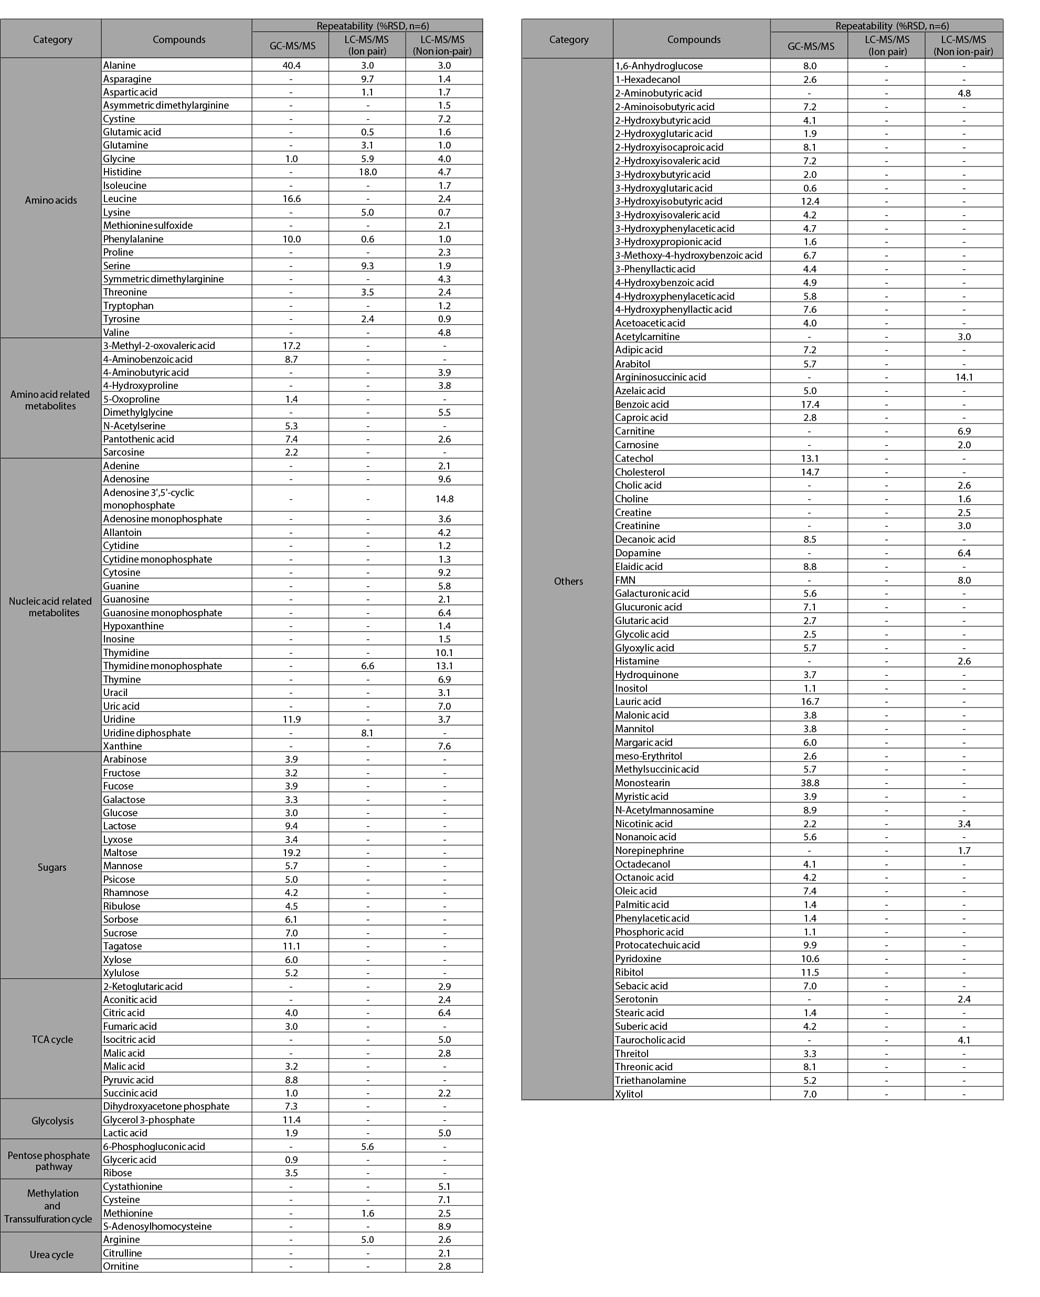
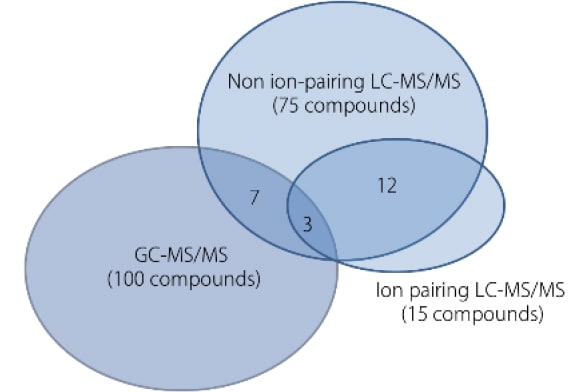
Fig. 4 The Number of Metabolites Detected from Mouse Fecal Extracts
A Comparison of Young Mice and Old Mice
As an example application, we analyzed and compared the feces of male C57BL/6J mice reared in a normal environment but of different age in weeks (10 weeks old and 70 weeks old). A total of 66 metabolites were detected. In order to compare the content of metabolites in both mice, we used the Shimadzu Multi-omics Data Analysis Pack to create graphs of peak area ratios of the 66 detected metabolites with respect to internal standard substances. The results as indicated in Fig. 5 suggest that there is a difference between the two groups with regard to various metabolites including amino acids such as arginine, aspartate, and lysine, nucleic acid metabolites such as adenine and adenosine, and cholic acid. In terms of cholic acid, results indicated that the content tends to be lower in the feces of old mice compared to young mice. Cholic acid results from the deconjugation of taurocholic acid. Probable causes of the low cholic acid content in the feces of old mice may be that the secretion of bile acids or the number of bacteria which cause deconjugation decreased due to age. Regarding arginine, the content tended to be lower in the feces of young mice compared to old mice. Arginine in the intestinal lumen is absorbed and used for the synthesis of polyamines which are indispensable for cell growth. This suggests that the arginine content may be low in young mice because they are actively absorbing arginine from the intestinal lumen and synthesizing polyamines. As demonstrated so far, this method can also be considered to be effective in investigating the factors of aging using feces.
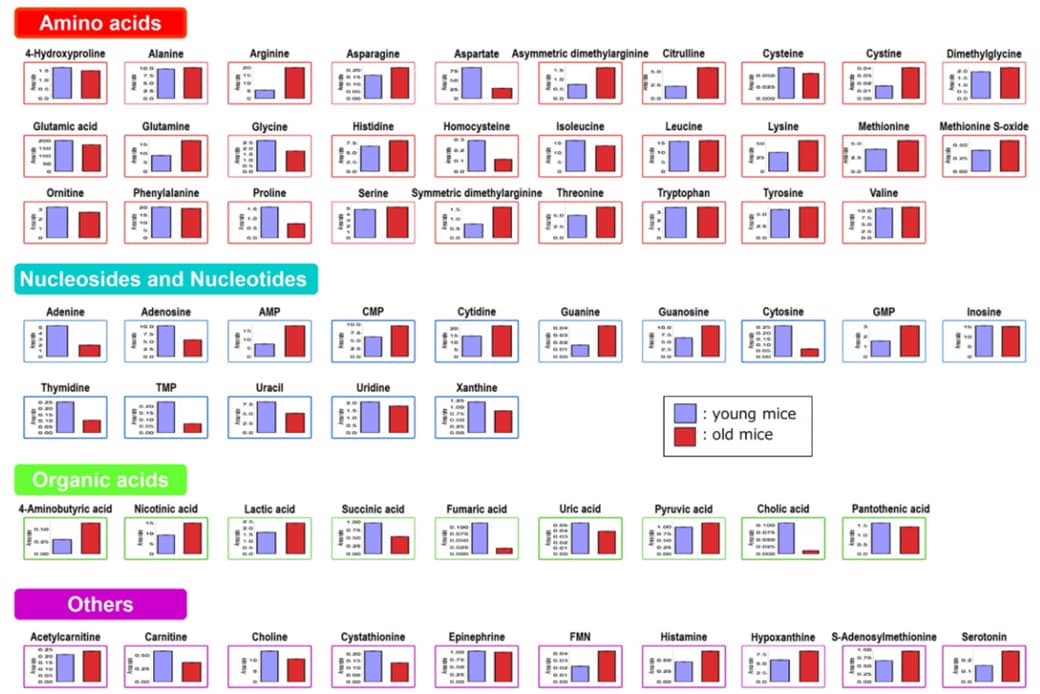
Fig. 5 A Comparison of the Individual Metabolite Content Detected in the Fecal Extracts of Young Mice and Old Mice
Conclusion
We introduced a comprehensive measurement of the metabolites in mouse feces using GC-MS/MS and LC-MS/MS. Since the compounds that can be measured differ between GC-MS/MS and LC-MS/MS, using both analysis methods enables a comprehensive measurement of the metabolites. In addition, by using the MRM database for GC-MS/MS and the method package for LC-MS/MS, comprehensive measurement can be done easily even by those who are not very familiar with measurement. The immense data obtained by the measurements can be then visualized using the Shimadzu Multi-omics Data Analysis Pack, which will facilitate the examination of the results. These measurement and analysis methods are expected to be highly effective for metabolomic analyses.