Thermal Stability Analysis of Nucleic Acid Drugs by TMSPC™-8 Tm Analysis System
Functional nucleic acids, beginning with nucleic acid drugs, have attracted considerable attention in recent years. In the development and evaluation of these functional nucleic acids, it is essential to understand their thermal stability, as this is a factor that controls their structure and functions. Thermal stability analysis is also indispensable in techniques based on hybridization of nucleic acids such as PCR and DNA microarray.
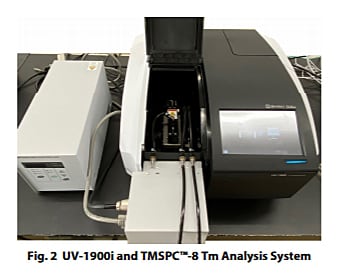
In this article, a thermal stability analysis (Tm analysis) of a nucleic acid was conducted using a Shimadzu UV-1900i ultraviolet-visible (UV-Vis) spectrophotometer and TMSPC-8 Tm analysis system. Simple calculation of the Tm value of nucleic acids is possible by using this system.
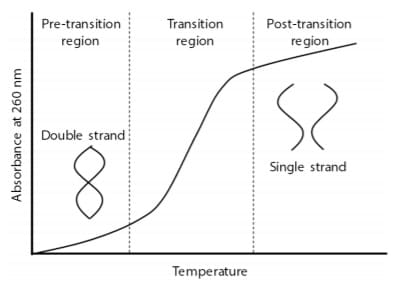 Fig. 1 Melting Curve of Nucleic Acid
Thermal Behavior of Nucleic Acids
Nucleic acids (DNA, RNA) have a double-stranded helix structure, but the hydrogen bonds that join the strands are broken when the temperature is raised, and the doublestrand structure gradually dissociates and forms a singlestrand structure. This phenomenon is called “melting” of nucleic acids, and the temperature at which the ratio of the single strand to the double strands becomes equal is defined as the melting temperature Tm. Tm is an index of the thermal stability of nucleic acids, and depends on various factors such as the base sequence, nucleic acid concentration, and mismatch (non-complementary base pairs). It is known that nucleic acids have an ultraviolet absorption peak at around 260 nm, and their absorbance at 260 nm increases when melting occurs (Fig. 1). The Tm analysis system of the spectrophotometer determines the Tm value by measuring this change in absorption.
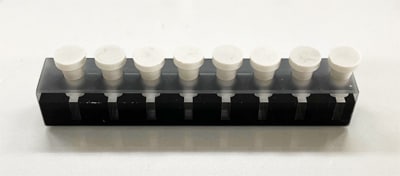 Fig. 3 Dedicated 8-Series Micro Cell (Pathlength: 10 mm)
Tm Analysis of Nucleic Acid by TMSPC-8
In this experiment, the nucleic acid M13-25mer was used as the sample. As pretreatment, the sample solution was degassed, as bubbles will form at high temperature if air is dissolved in the sample solution, making accurate measurement impossible. Annealing is also necessary to ensure complete formation of a double-stranded structure of the sense and antisense strands. Here, annealing was carried out by holding the samples at 95 °C for a minimum of 10 min, followed by cooling at a rate of 2 °C/min. Two optical pathlengths, 10 mm and 1 mm, are available with the dedicated 8-series micro cell, and can be selected depending on the sample absorbance (concentration).
In this experiment, the samples were prepared so as to have absorbance of 0.5 to 1 at 260 nm, and the cell with the 10 mm pathlength was selected (Fig. 3).
Fig. 4 shows the melting curves obtained by the Tm analysis (curves in which absorbance at 260 nm is plotted against temperature). The figure shows the results for both temperature ramp-up and ramp-down. From Fig. 4, it can be understood that absorbance increases as the temperature rises. Moreover, the melting curves can be divided into three regions from the low temperature side, i.e., the pre-transition region, transition region, and post-transition region. Larger ratios of the double-strand structure and the single-strand structure exist in the pre-transition region and the posttransition region, respectively.
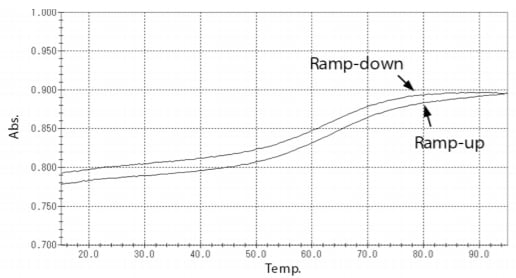
Fig. 4 Melting Curves of Samples
The Tm value was calculated by two calculation methods, the average method and the derivative method. Table 1 shows the results of Tm value obtained by these two analysis methods. Similar results were obtained for ramp-up and ramp-down, respectively.
Table 1 Results of Tm Analysis
| Calculation method | Tm value(℃) | |
| Ramp-up | Ramp-down | |
| Average method | 63.58 | 63.56 |
| Derivative method | 63.68 | 64.10 |