High Sensitivity Analysis of Testosterone in Human Serum Using LCMS™-8060NX
LCM-8060NX
This report introduces an example of high sensitivity analysis of testosterone in serum using LCMS- 8060NX, a triple quadrupole mass spectrometer. Calibration curves prepared using standard samples showed linearity in the concentration range of 0.05 - 1000 pg/mL (R2 =0.9996), with %RSD of concentration of 2.47% at the lower limit of quantification and accuracy at each calibration point ranged from 94.64 - 111.04%. Furthermore, the accuracy of serum samples spiked with testosterone (1 pg/mL) was 105%, indicating that the method used in the analysis is suitable for the actual samples.
Testosterone (Fig. 1), an androgen produced in the testes and the adrenal glands, is a steroid hormone which contributes to the growth enhancement of bones and muscles and hematopoiesis. The free-testosterone level in blood plays a key clinical role as a biomarker for a variety of diseases, such as Cushing’s syndrome and tumors. Testosterone levels in blood have usually been measured using immunoassay, but these levels may be affected by the cross reactivity caused by steroid hormones having similar structures. LC/MS/MS with high selectivity prevents the problems caused by the conventional method and enables more accurate quantitative analysis, and it is expected that it will come into clinical use.
Sample Preparation
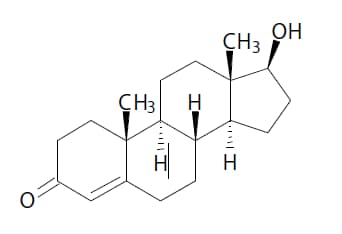
Fig. 1 Structural Formula of Testosterone
Standard samples were serially diluted with 50% methanol, prepared at concentrations of 0.05 - 1000 pg/mL and used for preparation of the calibration curve.
For the samples spiked with serum, commercially available steroid-free human serum was spiked with testosterone to make a serum concentration of 1 pg/mL. The standard sample and internal standard were spiked with 100 μL of serum, and then shaken well with a mixture of hexane and ethyl acetate (9 : 1). The solution obtained was centrifuged for 10 minutes, followed by evaporating the organic solvent layer to dryness, and then re-dissolved with 50%methanol.
Analytical Conditions
The analytical conditions for HPLC and MS are shown in Table 1. TheMRM transitions are shown in Table 2.
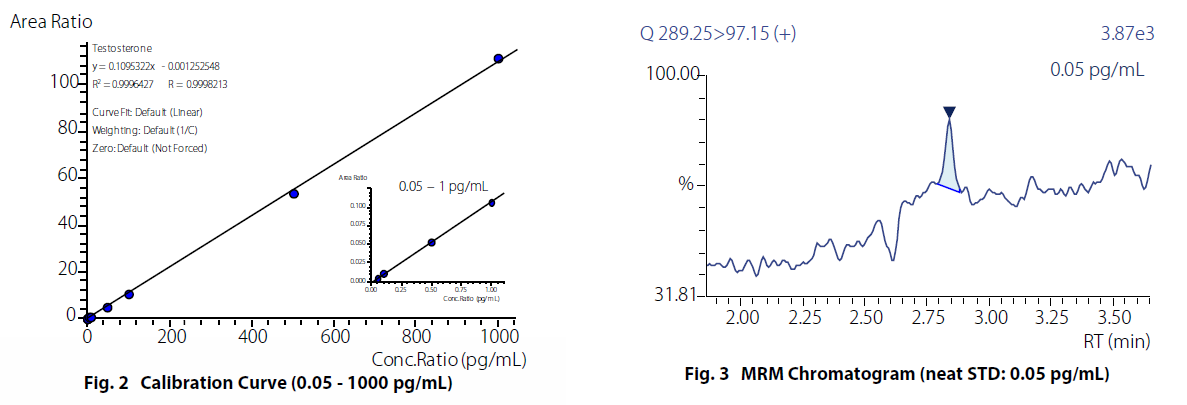
Calibration Curve
The calibration curve prepared using the standard sample (internal standard method, n=3 for each concentration) showed good linearity in a wide dynamic range from 0.05 - 1000 pg/mL with a coefficient of determination (R2) of 0.9996. The %RSD of concentration at the lower limit of quantification (0.05 pg/mL) was 2.47% with the accuracy at each calibration point ranging from 94.64 - 111.04%. Fig. 2 shows the calibration curve, and Fig. 3 shows the MRM chromatogram of the 0.05 pg/mL standard solution.