Traverse MS
Multivariate Analysis Software That Supports MRM Data
Traverse MS data analysis software is intended for high-speed processing of MRM data acquired with Shimadzu triple quadrupole LCMS systems in the field of targeted metabolomics. Using multiple samples and multiple components, the software is able to create graphical and statistically analysis for metabolic pathway analysis.
Note: The software is a product of Reifycs Inc.
Features
Displays Multiple Chromatograms in a Single Window
The chromatograms for multiple components from a single sample or from multiple samples can be displayed side-by-side. The side-by-side feature allows for better data visualization, making the peak identification process easier. The unique characteristics of this user interface provide an efficient process of identifying peaks for multiple components.
Peak Identification Algorithm Specialized for MRM Data
The peak identification algorithm, which is specialized for MRM data, processes data for multiple samples and multiple components at high speeds. The algorithm assigns scores to target component peaks based on their similarity to specified reference peaks.
Graphing Area Values (and Area Ratios) for Multiple Samples
After identifying peaks in MRM data, the software graphs the peak area values for each component or peak area ratio values for internal standard substances. By separating the samples into groups, the mean area values and standard deviation values for target components can be graphed for comparison between multiple groups. Graphing comprehensive analytical data in this way enables users to understand analytical results more intuitively.
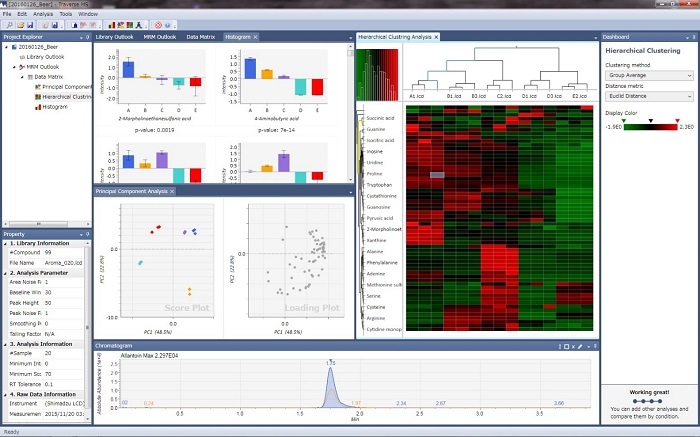
Statistical Analysis Based on Principal Component Analysis and Hierarchical Cluster Analysis
MRM data from multiple samples and multiple components can be analyzed using statistical analysis techniques such as principal component analysis and hierarchical cluster analysis. Analyzing massive amounts of MRM data individually can be extremely time-consuming, but statistical analysis techniques provide users with visual and easy-to-understand analytical results.
Supports Metabolic Pathway Analysis
In order to understand the metabolic fluctuations in biological organisms, it is important to understand the metabolic fluctuations that occur along metabolic pathways related to target components. This software includes basic metabolic maps for glycolytic systems, pentose phosphate, and amino acid synthesis pathways, which can be loaded to display representative metabolic pathways. By linking the graphed fluctuations in each metabolite, metabolic pathway analysis is achieved.
Display Multiple Chromatograms Concurrently Using MRM Outlook Function
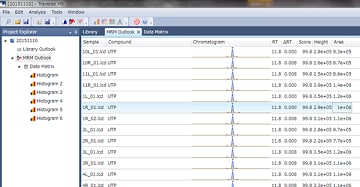
The MRM Outlook function can be used to confirm detected peaks and make necessary corrections by checking chromatograms from all samples against a reference chromatogram for each metabolite.
Conventional methods required visually checking each chromatogram from each sample one at a time, which is not efficient. However, the automatic identification algorithm specialized for MRM data and MRM Outlook function significantly reduces the work involved and increases efficiency.
Creating Graphs from a Data Matrix
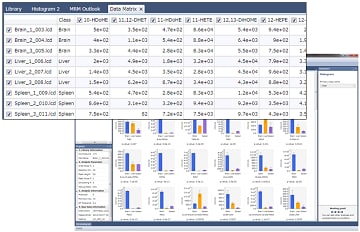
Data Matrix can categorize the data into "Classes" and normalize the data based on values. The height and area of each peak is determined from the chromatograms for each target component. Based on these values, the software displays bar graphs of the average and standard deviation of height or area values for the classes. These histograms allow for the users to view the data easily.
Metabolic Pathway Analysis
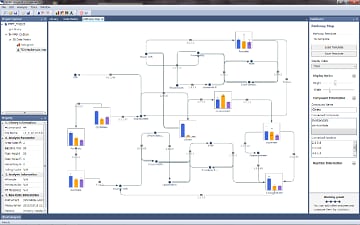
The software displays representative metabolic pathways by loading a template metabolic map file or creating a new metabolic map file.
Compound graphs created from a data matrix can be linked to create metabolic pathways, so that users can understand compound metabolite fluctuations of interest in more detail.
Remarks and Precautions
- 1. For Research Use Only. Not for Use in Diagnostic Procedures.
- 2. Shimadzu makes no warranty regarding the accuracy of information included in the database or the usefulness of information obtained from using the database.
News / Events
-
LabSolutions Insight Profiler, Non-Targeted Analysis Software for LC/QTOF Data has been released
LabSolutions Insight Profiler is a unified, end-to-end workflow for LC/QTOF data processing — with a "single-click" approach. Insight Profiler is purpose-built for non-targeted analysis in suspect screening, unknown identification, and metabolomics across complex sample sets.
-
Cell Culture Profiling for LCMS-2050
This package includes a preconfigured method covering vitamins, amino acids, and other culture media components and metabolites secreted by cells.
-
Shimadzu has released the LCMS-8065XE
The new LCMS-8065XE is a triple-quadrupole mass spectrometer with EVOLVED, EFFICIENT, and EXACT capabilities. These exceptional capabilities ensure high reliability and enhanced productivity, empowering the laboratory for the future.
-
Latest issue of Shimadzu Journal, featuring Environmental Analysis, has come out.
This issue showcases advanced technologies and research tackling the global challenges posed by PFAS. As part of Shimadzu’s ongoing commitment to sustainability and problem solving, we strive to reduce environmental impacts and build a better future.
-
New High Resolution Accurate Mass Library for Forensic Toxicology
Perform forensic toxicology screening for drugs of abuse, psychotropic drugs, pharmaceuticals, pesticides, and natural toxins using this high-resolution accurate mass database.
-
Shimadzu has released the Shim-vial™ H glass, S glass.
Shimadzu provides high-quality vials that thoroughly eliminate these risks by visually inspecting each vial, allowing them to be used with confidence.