Method Development System - Features
Automatic Optimization of Gradient Conditions with AI Algorithm
Optimization
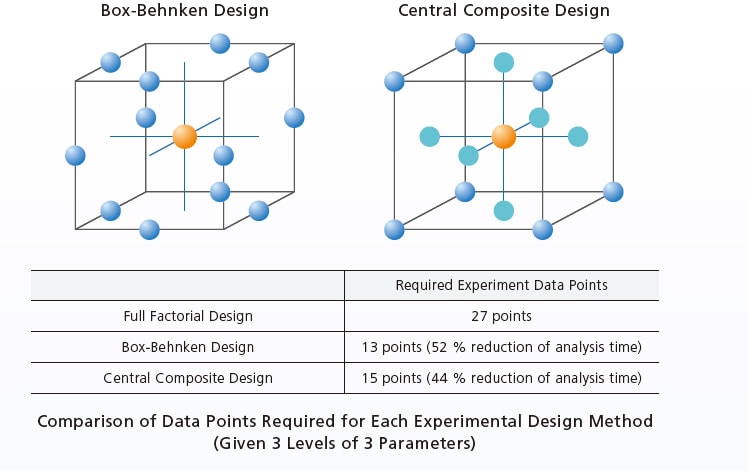
Reduce the Number of Data Points Using Experimental Design
Box-Behnken design and central composite design can shorten analysis times because they require fewer data points than full factorial design. For example, if determining the three optimal levels for the organic mobile phase mixture ratio, pump gradient conditions, and column oven temperature, full factorial design requires 27 data points (3 × 3 × 3) for optimization whereas Box-Behnken design requires 13 points and central composite design requires 15 points.
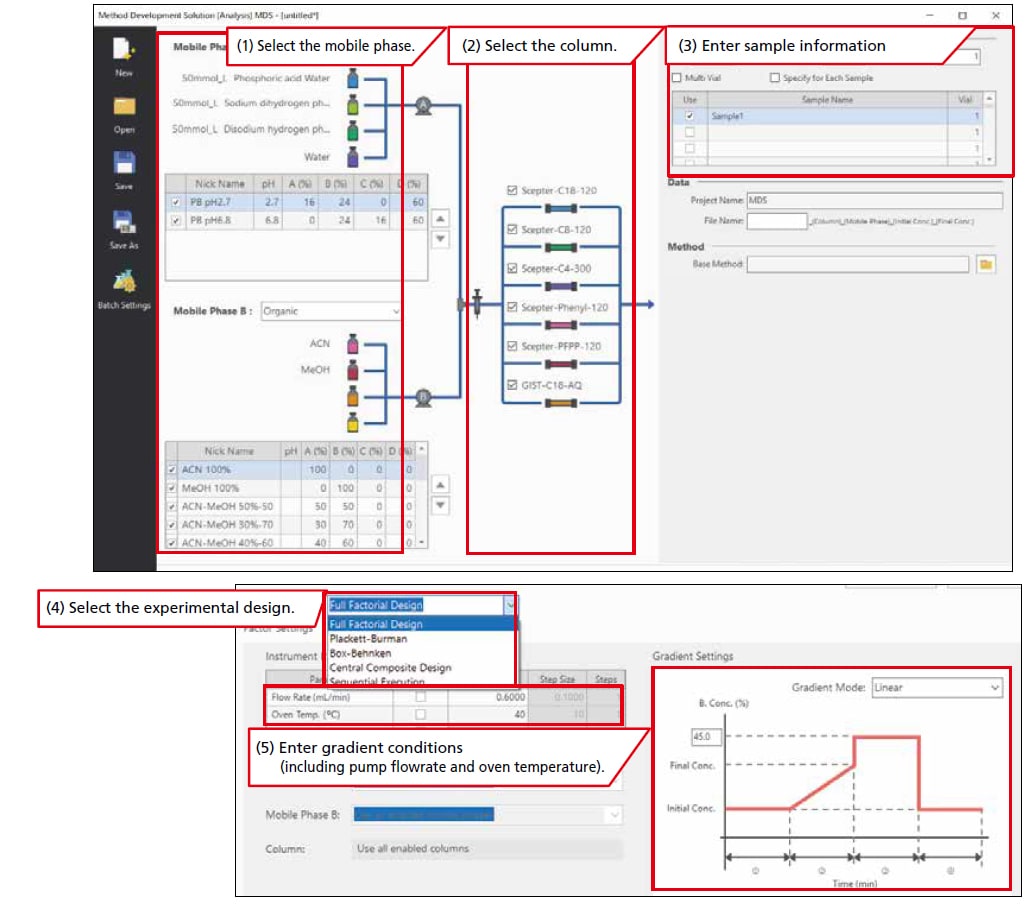
Easily Creates Analysis Schedules with Experimental Design
The process of creating the vast number of method files and analysis schedules required for screening can be completed quickly by simply following steps (1) to (5) below. The mobile phase and column can be selected with a single click and a comprehensive schedule reflecting column equilibration and blank analysis is generated automatically. In addition to improved operational efficiency, this process can reduce human errors. The experimental design can also be selected with a single click.
Easy Creation of Analysis Schedule
Quickly Determine Optimal Condition
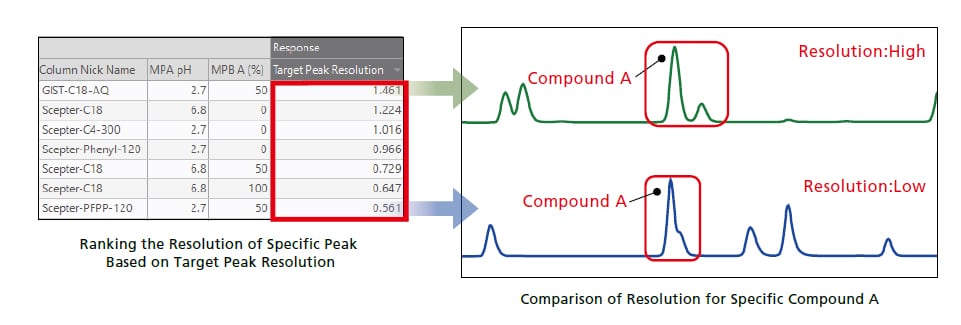
Because screening generates as many chromatograms as the number of conditions considered, they must be evaluated to determine which is optimal. If all the chromatograms had to be scrutinized by an operator, it would be very tedious. LabSolutions MD can quickly and easily determine optimal analytical conditions using equation (1) below to quantitatively evaluate the separation status resulting from each analytical condition.
*Method Scouting Solution can be used in conjunction with optional software multi-data reporting.
E = P×(Rs1+Rs2+…RsP) … (Eq. 1)
The evaluation value (E) is calculated as the number of peaks detected (P) multiplied by the sum of the separation level (Rs) for all peaks.
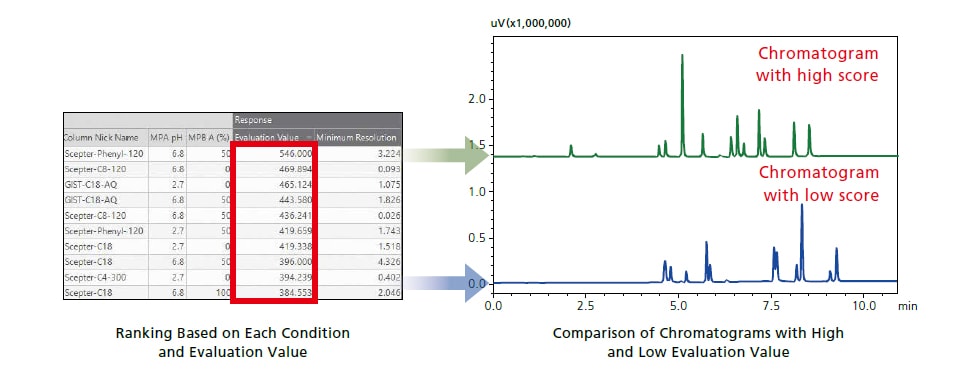
Target Peak Resolution can be used to evaluate the resolution on a specific peak while Evaluation Value considers all the peaks detected.
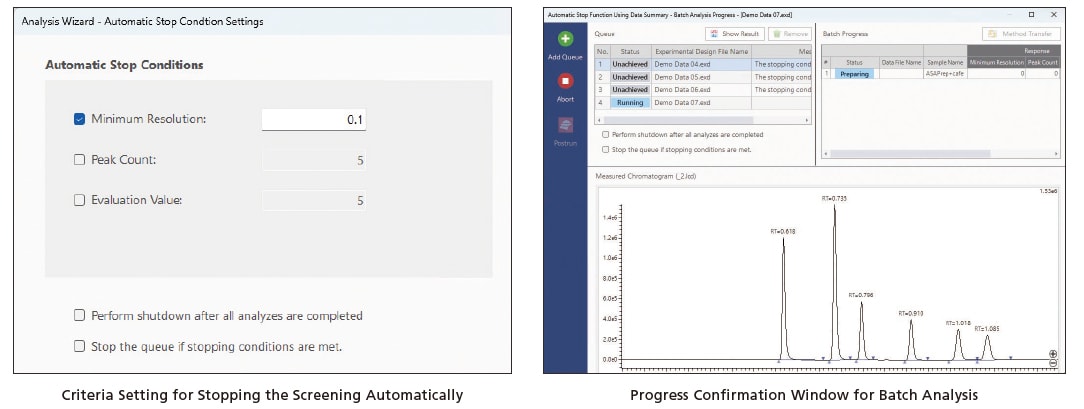
Complete Screening More Efficiently with the Automatic Stop and Schedule Functions
In screening for analysis method development, the various combinations of mobile phases and columns are comprehensively examined, with takes time. With LabSolutions MD, an automatic stop function for screening is built in, so the search can be ended if conditions are found that match the configured standards. Furthermore, with the multiple registration function for screening, different screening conditions can be automatically searched for in sequence.
Identify the Most Robust Analytical Condition by Design Space
Visualize the Most Appropriate Analytical Conditions by Design Space
Using the configured conditions for the initial screening, the organic mobile phase mixing ratio, column oven temperature, and final concentration of the gradient were optimized. The optimized results are displayed using the LabSolutions MD design space drawing function, so the degree of separation, symmetry coefficient, and number of theoretical plates were evaluated.

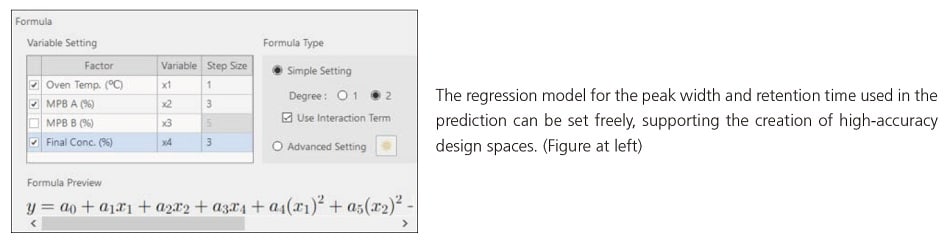
Prediction of Chromatograms for Any Set of Analytical Conditions
Click on the analytical conditions at any point A (the blue square in the black circle). The software can then display a visual prediction of the changes to the chromatogram when the analytical conditions are changed. This function allows quickly observing how the separation will change without running an analysis.

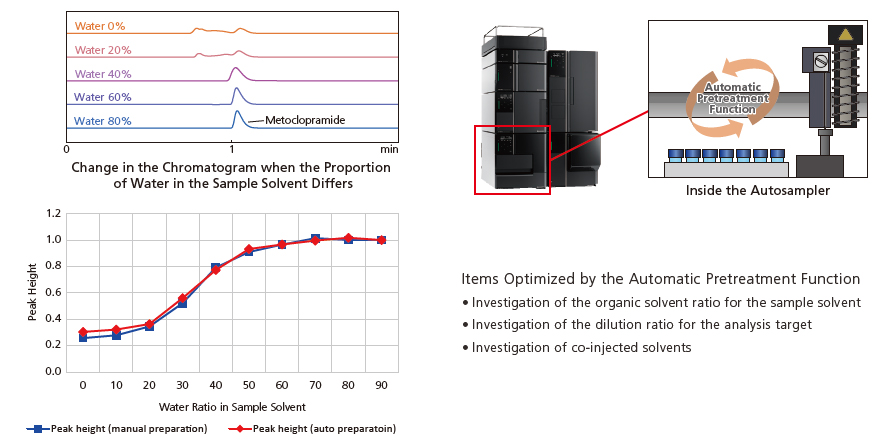
Support for Method Development from the Analysis Sample Adjustment Stage
In LC method development, it is important to consider the composition of the sample solvent in order to obtain appropriately shaped peaks. If the sample solvent has a stronger elution capacity than the mobile phase, the concentration of the solute at the column inlet will be insufficient, which is known to broaden the peaks. Using LabSolutions MD, analysis can be performed while automatically changing the sample solvent composition. As a result, the impact of the sample solvent composition on the peak shape can be checked without the need for manual adjustment, substantially reducing the effort involved in determining the optimal sample solvent composition.
Related Application
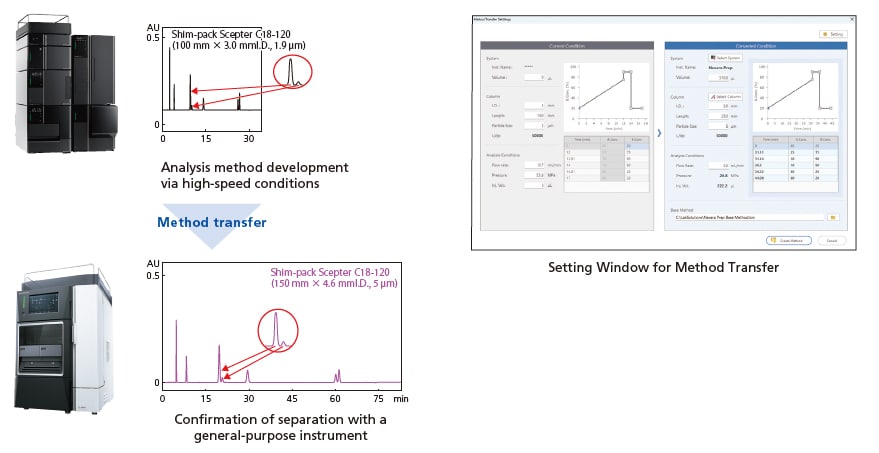
Support for Method Transfer from a System for Analysis Method Development to a General-Purpose System
Analysis methods are sometimes transferred to general-purpose instruments after development with dedicated instruments. This procedure is called method transfer. The analysis method must be adjusted depending on the columns used and the change of instrument. LabSolutions MD has a method conversion function for transferring from the system used for analysis method development to the actual operating instrument. Further, the function can investigate the conditions using a system and columns suited to high-speed analysis, and convert the results to a method for a general-purpose instrument.
Related Application
Robustness Evaluation
Evaluating Robustness Using Sequential Experimental Design
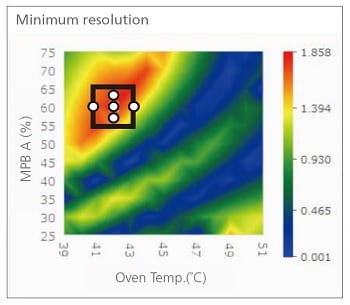
LabSolutions MD can create a sequential experimental design to perform robustness evaluation, which is an important process for understanding how variations in parameters will affect results and for ensuring the reliability of methods. LabSolutions MD creates a sequential experimental design automatically by changing the parameters of an optimized method in a small range to evaluate the robustness. In this example, the mixture ratio of organic mobile phase was changed by 1 % (59, 60, 61 %) and oven temperature by 1 °C (41, 42, 43 °C) (white circles in the right figure) to verify the effect on separation.
Below shows chromatograms obtained for robustness evaluation. Varying the parameters had little effect on separation, showing robustness of the optimized method constructed by design space.
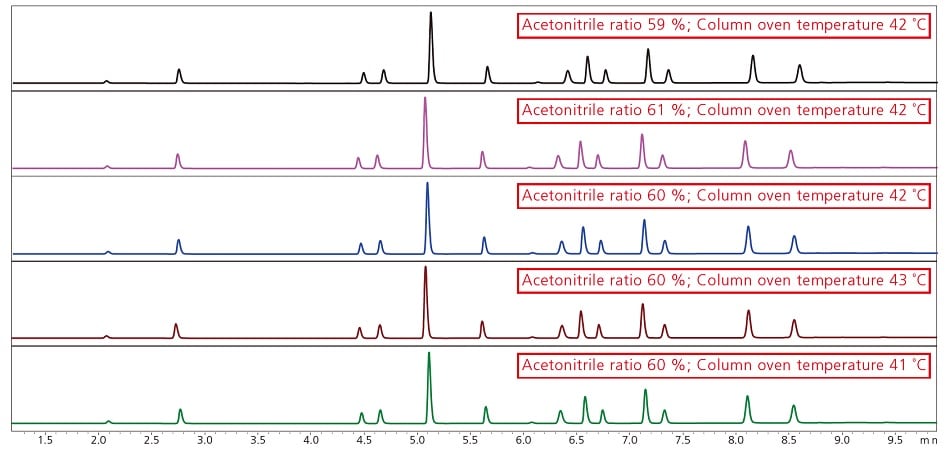
Chromatograms of Robustness Evaluation at Each Data Point
Automatic Identification of Compounds by Peak Tracking (i-PeakTracer™)
i-PeakTracer automatically sets the parameters for peak tracking to make it effortless for anyone to track peaks through all the data.
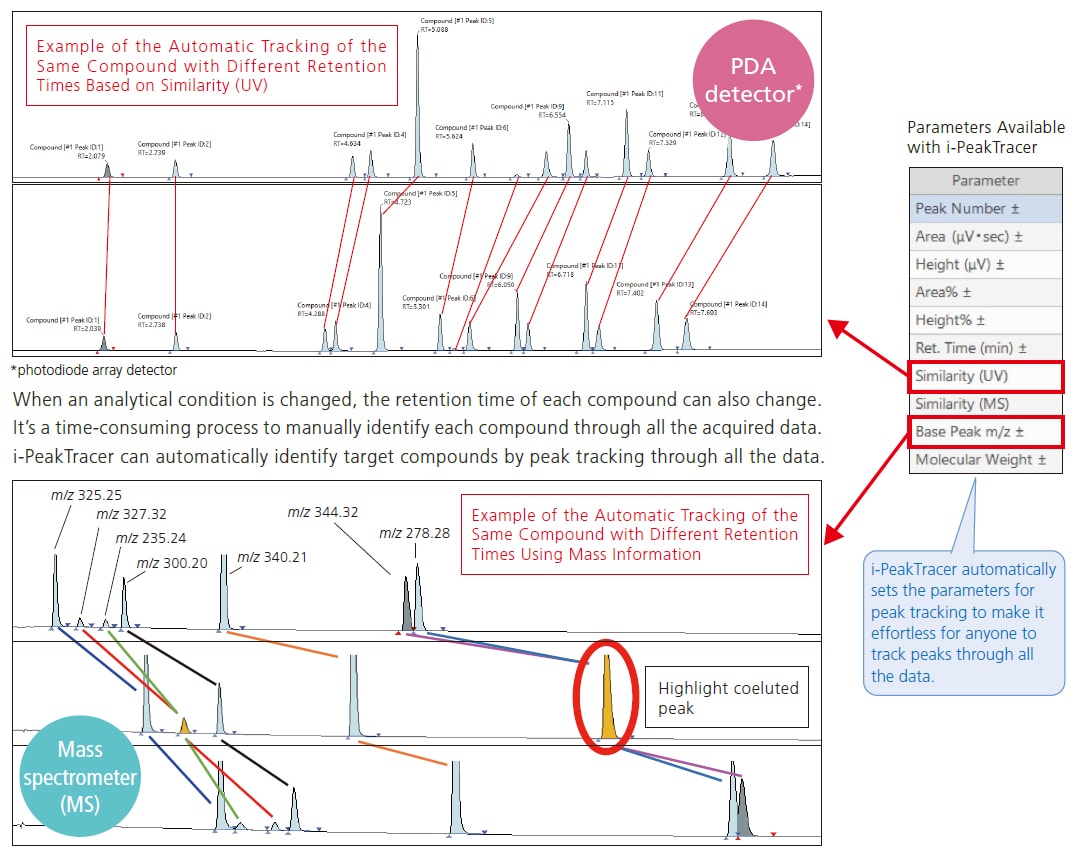
By using mass information, the software can perform highly reliable peak tracking even for compounds with similar UV spectra. Further, peaks suspected of coeluting are highlighted in orange. For oligonucleotides, peptides, and other medium-sized molecular compounds, peak tracking can be performed using molecular weights estimated by deconvolution.
Related Application
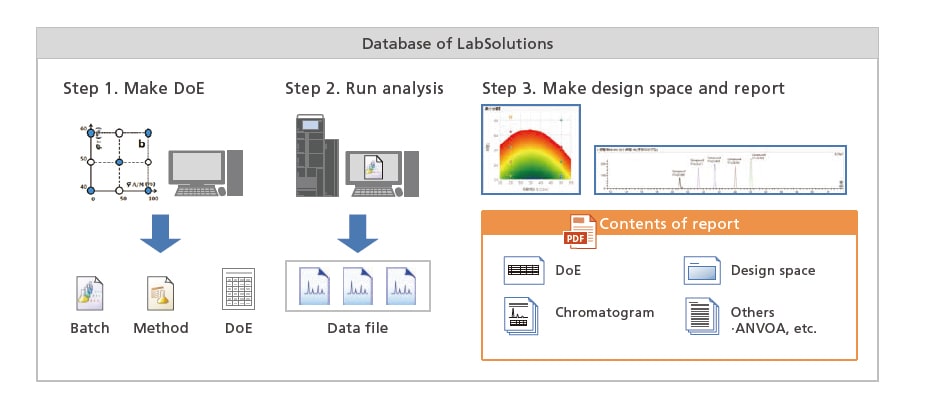
Ensure Data Integrity by Database Management
LabSolutions MD ensure data integrity by managing all the data in a single database of LabSolutions.This database enables seamless operation, from creating an analysis schedule and running the analysis to data processing using design space, and eliminates time-consuming file importing or exporting steps.
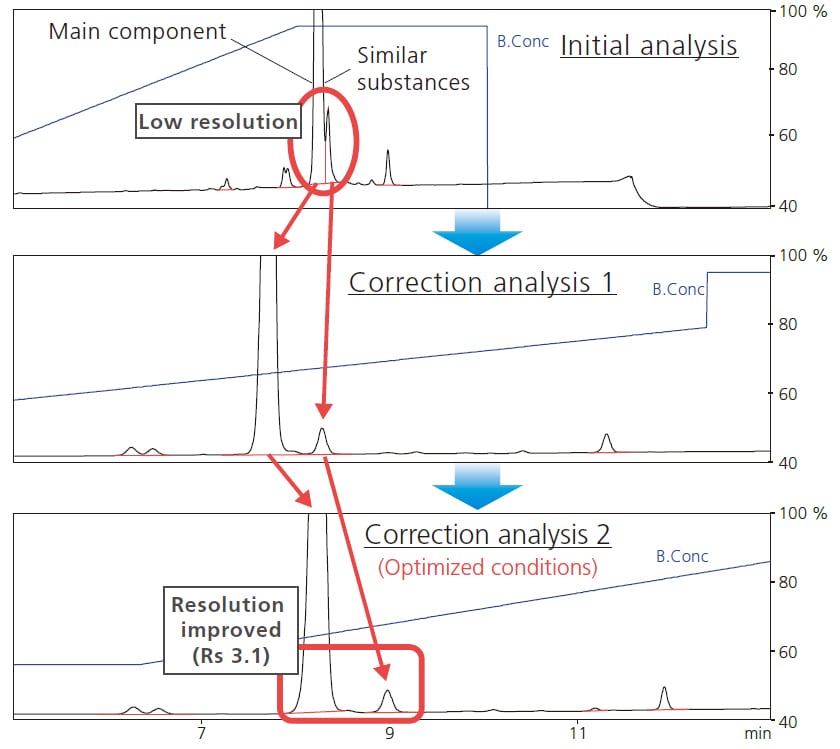
Automatic Optimization of Gradient Conditions
AI Algorithm Automatically Optimizes Gradient Conditions
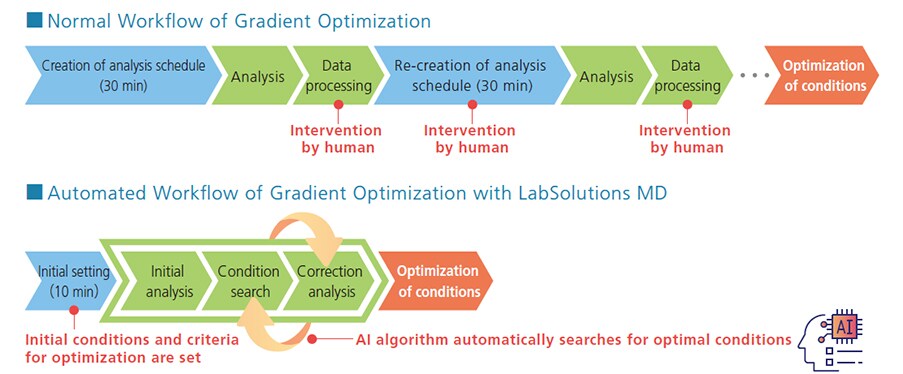
LabSolutions MD has a unique AI algorithm for automatic optimization of gradient conditions. By setting resolution criteria, it automatically searches for the gradient conditions that meet the criteria.In a normal method development workflow, human intervention is required for creating analysis schedules and performing data analysis. In contrast, LabSolutions MD automatically generates and registers improved gradient conditions based on the data obtained, enabling exploration and optimization of gradient conditions without human intervention.
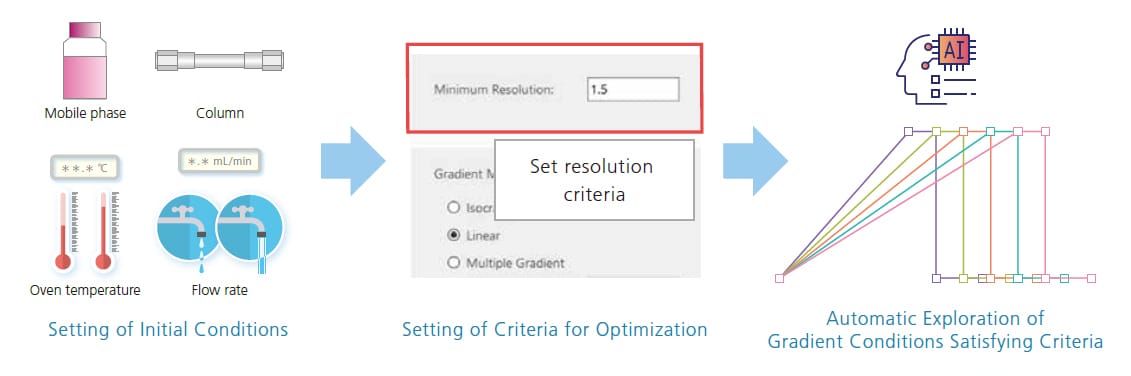
Setting of Resolution Criteria for Automatic Optimization
By setting initial conditions of gradient curves and resolution criteria, the gradient conditions that meet the criteria can be automatically searched.
With AI-driven automatic exploration, anyone can search for the conditions regardless of their chromatography experience.
Related Technical Report
Capable of Selecting the Optimal Mode for the Application
There are two ways to perform automatic optimization of gradient conditions: all-peak resolution mode and specified peak resolution mode. They can be applied separately to suit the application.
All-peak resolution mode
In this mode, the software searches for conditions satisfying the criteria for resolution configured for all the peaks detected. It is used when all the peaks must be resolved.
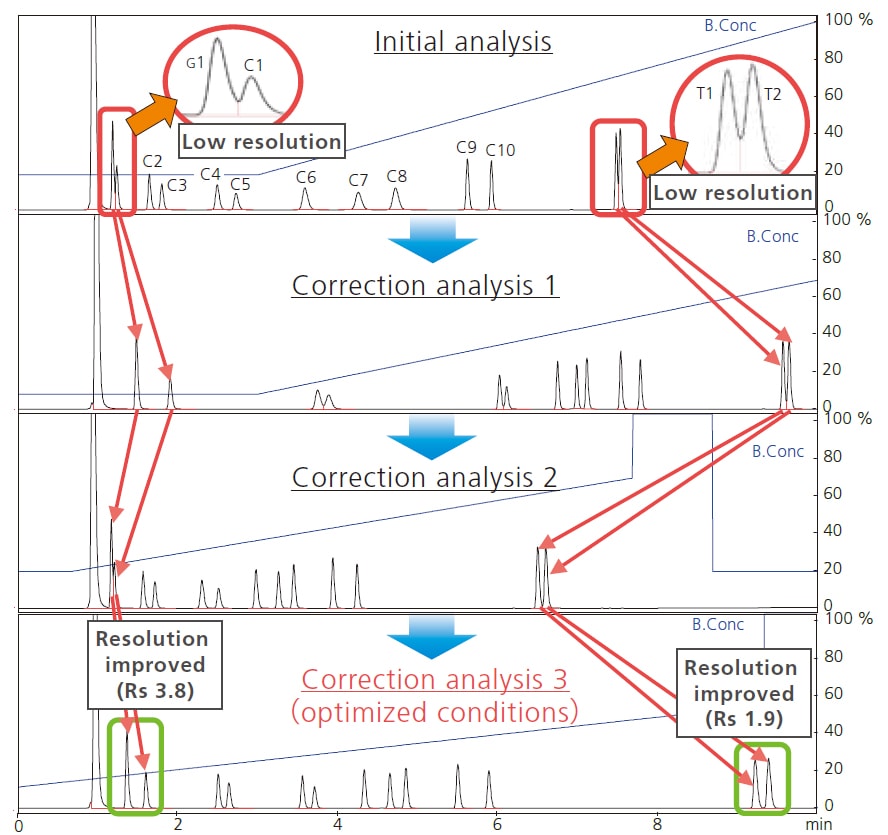
Automatic Gradient Optimization by AI(Catechin and Theaflavin)
Related Application
Specified peak resolution mode
In this mode, the software searches for conditions satisfying the criteria for resolution configured for any peaks selected. It is used when specific peaks must be separated.
Automatic Exploration of Gradient Conditions Using AI (the Pharmaceutical Montelukast)
Related Application
Automated Column and Mobile Phases Switching
LabSolutions MD is compatible with the Nexera series, i-Series, and supercritical fluid chromatography (SFC). It is compatible with all LC detectors (UV, PDA, RID, RF, ELSD, and (AD) and, when used in combination with PDA and single quad LCMS, enables more accurate data analysis.
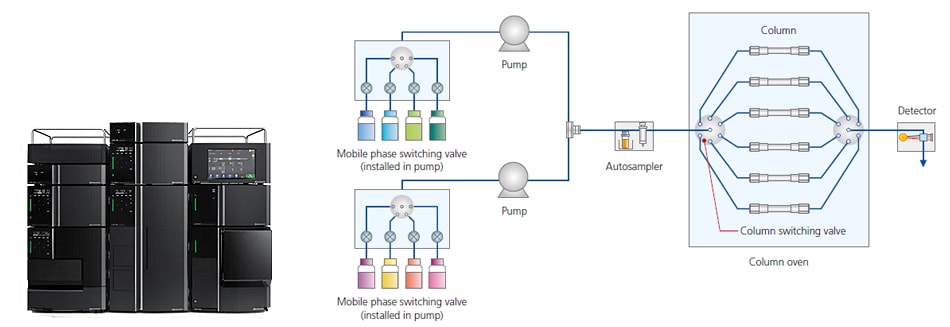
Nexera™ Series
These ultra-high-performance liquid chromatographs have a maximum pressure capacity of 130 MPa and support up to 192 combinations of 8 types of mobile phases and 12 types of columns (4 × 4 × 12).
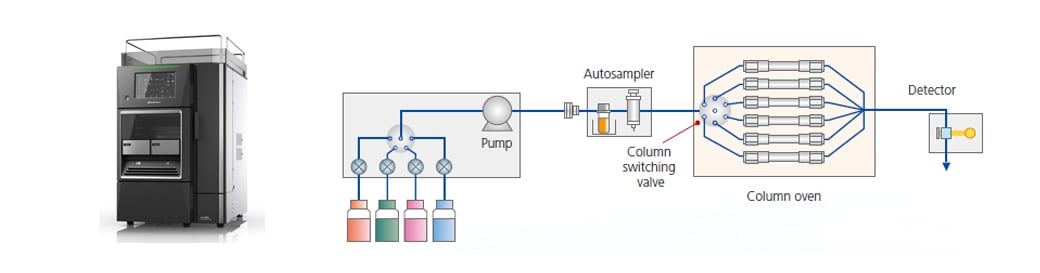
i-Series
This is an integrated LC system with a maximum pressure resistance of 70 MPa.
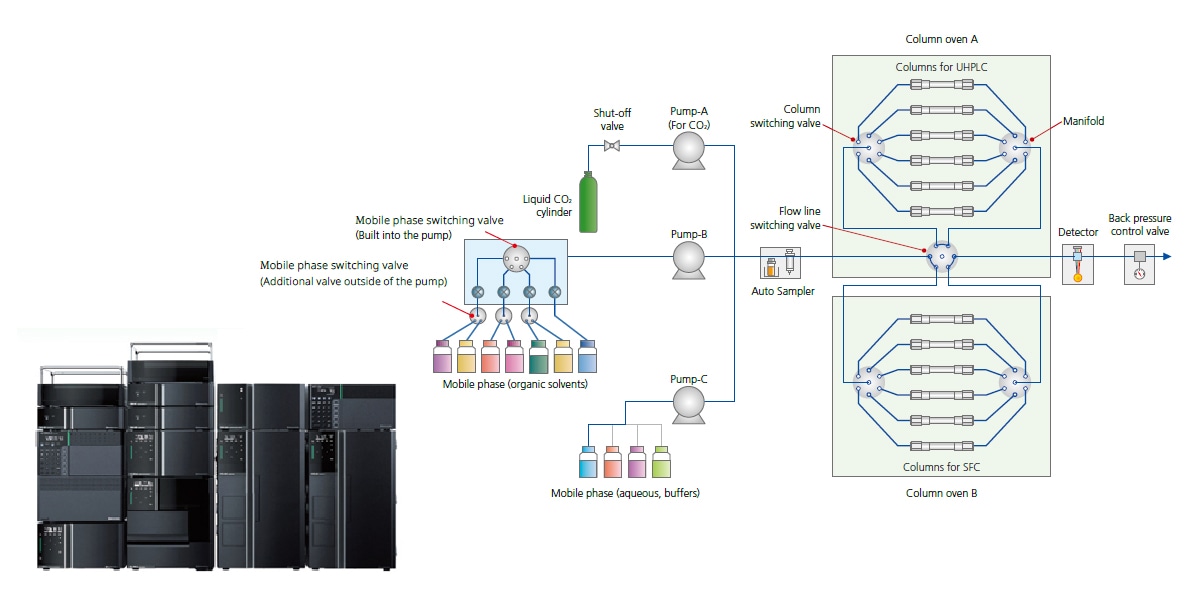
Supercritical Fluid Chromatograph Nexera/UCs UHPLC/SFC Switching System
By switching between LC and SFC in a single system, the optimum conditions can be determined more efficiently. In SFC analysis, mobile phases can be automatically switched up to seven lines.
Automation of Mobile Phase Preparation with Mobile Phase Blending Function
The mobile phase blending function can improve the efficiency of mobile phase preparation by automatically preparing mobile phases based on factors such as the user-specified pH level or the mixture ratio of organic mobile phase, with only a few types of mobile phases prepared in advance. This not only greatly reduces the burden of manual preparation but also prevents human errors in blending.
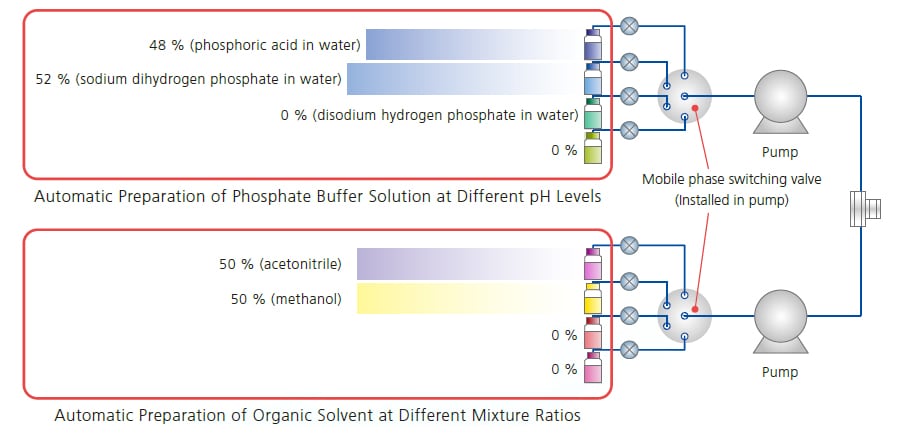
Automatic Mobile Phase Preparation with Mobile Phase Blending Function
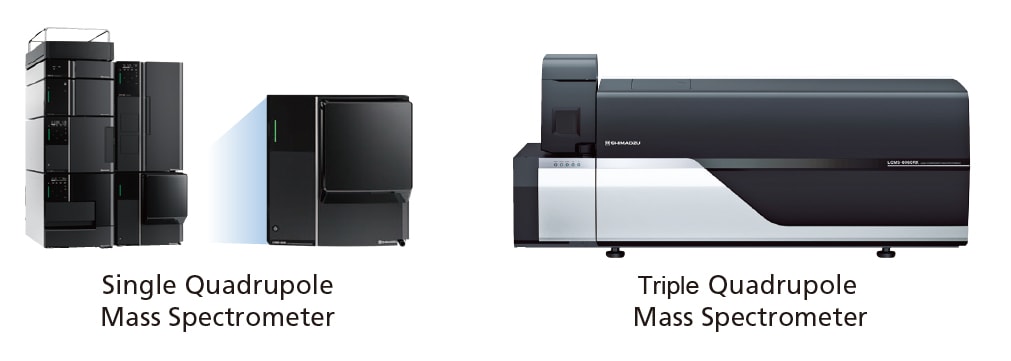
Combine with a Mass Spectrometer for Even More Productivity
With LabSolutions MD, peak tracking is possible using scan data from single quadrupole and triple quadrupole mass spectrometers. By taking advantage of the excellent selectivity of mass spectrometers, analysis method development for chromatograms with many eluted peaks can be carried out more efficiently.