MCT Series - Features
Micro Compression Testing Machine
MCT Manual Model
-
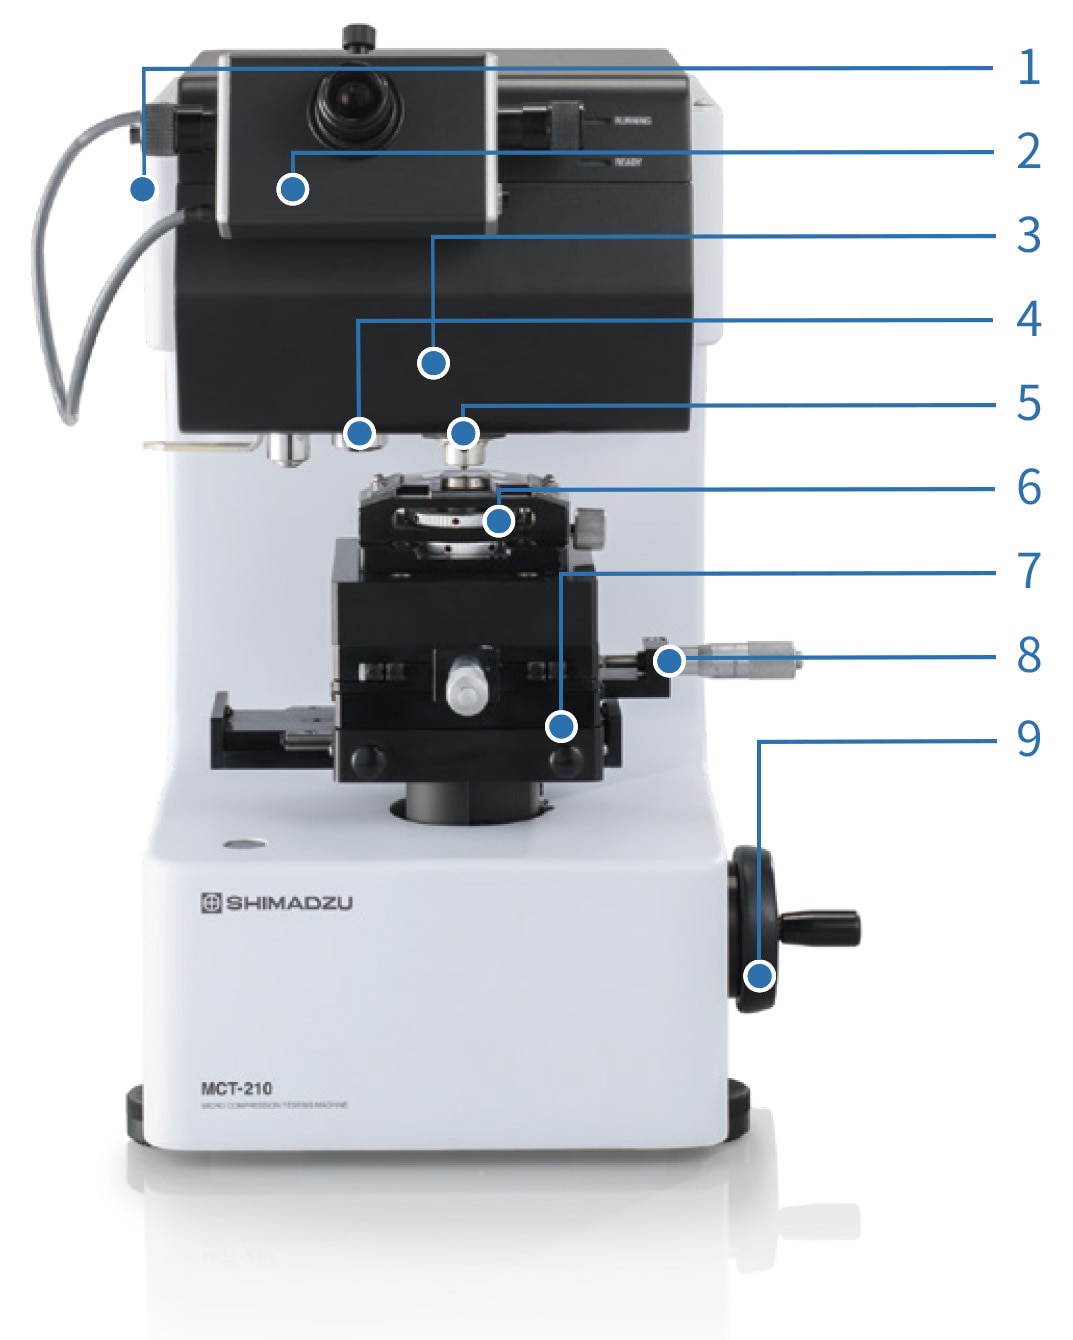
1. Loading Unit
- Wide Loading Range
Two types are available for compressing small materials, with maximum test forces of 4903 mN and 1961 mN. - High Accuracy Measurement
Test force is applied at an accuracy of ±1 % of the set or displayed test force, whichever is greater.
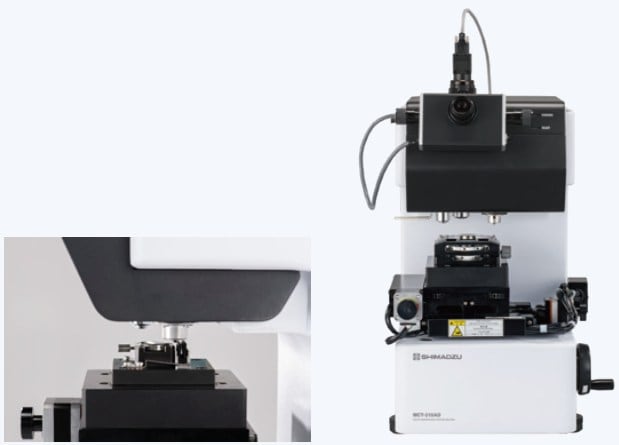
2. Optical Head (Micrometer)
- Sample Size Measurement Function Provided as Standard
By sandwiching the sample image viewed from above between two indicators, the geometric mean diameter and length can be measured. The measured size is displayed on a PC, and the strength can be calculated from this length and displayed.
3. Compression Displacement Measurement Unit
- Measuring Micro Compressive Displacements
To evaluate the compressive properties of micro materials, we provide a model with a measurement range of up to 100 μm with a resolution of 0.001 μm, and a model with a measurement range of up to 10 μm with a resolution of 0.0001 μm.
- Wide Loading Range
-
4. Objective Lens
For length measurement, we provide objective lenses with 50×magnification (standard) and 100× magnification (optional), and for observation lenses with 10× magnification (standard)and 20× magnification (optional).5. Indenter
We provide flat indenters with a diameter of 50 μm, 500 μm (optional), and triangular pyramid indenters with an angle of 115° (optional). A triangular pyramidal indenter is used for samples larger than 500 μm made from a material that does not break at a test force of 4903 mN.6. Lower Compression Plate Holder
This is a holder for securely holding the lower compression plate. The unit uses steel band tension to secure the plate. -
7. Slide Stage
The sample is moved under the indenter after determining the sample size using a micrometer. It has a click stop, enabling it to be loaded accurately at the position determined by the micrometer.8. X-Y Stage
A stage that can move 25 mm in the X-Y direction is provided as standard. A standard micrometer can be adjusted in increments of 0.01 mm. Also, a digital display option is available.9. Vertical Stage Shift Handle
This enables the stage to be smoothly raised and lowered. Coarse and fine adjustments can be made with this one knob.
Flow of Measurement in the Manual Mode

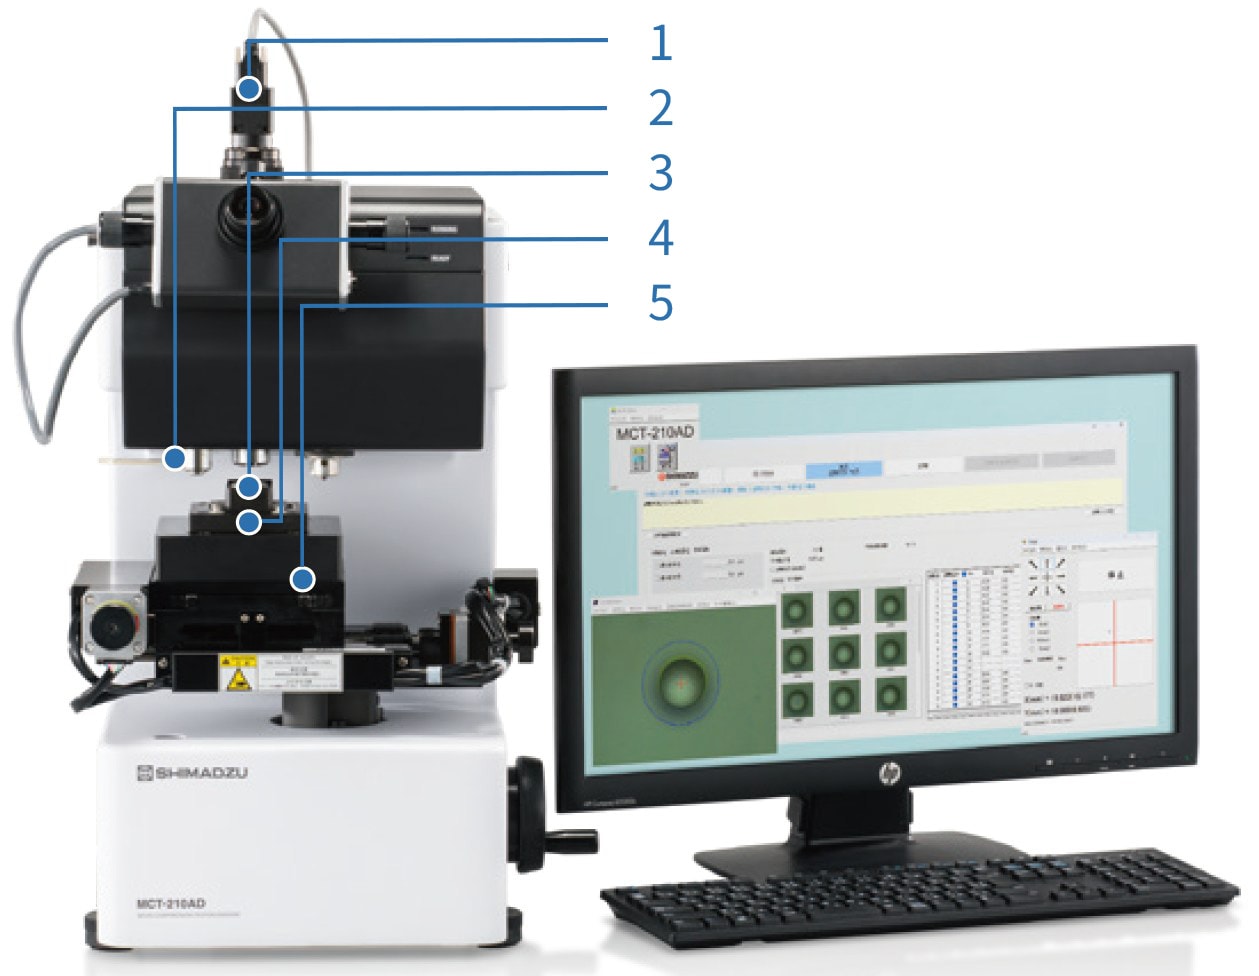
MCT-AD Model
-
1. Length Measurement Kit (Color)
- Measuring Lengths and Saving Images on the PC Window
An image of the particles viewed from above can be displayed on a PC, particles can be detected within an area of up to 10 mm × 10 mm via a wide-area scan, and the diameter and length of the detected particles can be measured. Digital data of particle images can be saved during measurement and after testing is completed.
2. Objective Lens
An ultra-long working distance 40× lens for length measurement and a 10× lens for observation are included.3. Cleaner
The indenter is automatically cleaned after each compression test.
- Measuring Lengths and Saving Images on the PC Window
-
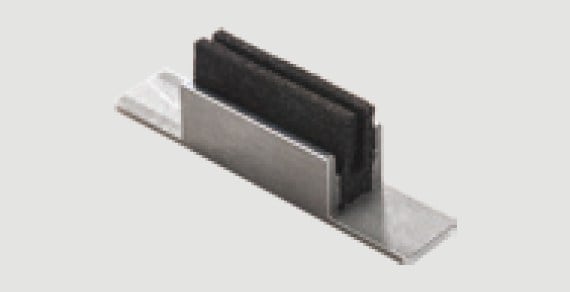
4. Lower Compression Plate Holder (Including a cleaner)
The compression plate has a structure that facilitates image capture. It can be easily installed and removed using screws from the side. -
5. Electric XY Slide Stage
- Improving Work Efficiency by Automatic Stage Control
The lower compression plate can be advanced in 0.001 mm increments by PC operation. While automatically controlling the X-Y stage, images of particles on the lower compression plate are continuously acquired, and up to 100 automatically detected particles can be tested continuously.
- Improving Work Efficiency by Automatic Stage Control
Features of the MCT-AD Model
-
Wide-area Scanning
The system performs wide-area scanning for automatic particle detection, then carries out automatic dimensional measurement using high-magnification images, allowing continuous testing of up to 100 particles.
-
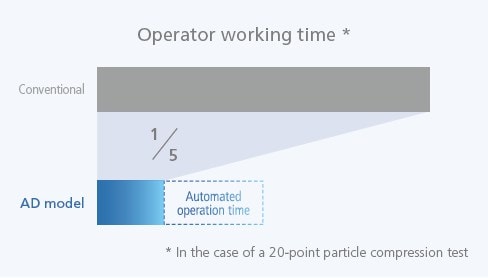
Automated Operation
By enabling automated operation, the system reduces operator workload to about 20%. Greater efficiency gains can be achieved as the number of measurement points increases.
Flow of Measurement in the Automatic Model

Preparation
-
Dispersion of Sample
The sample is dispersed onto the lower compression plate.
A dispersion tool (optional) is available. 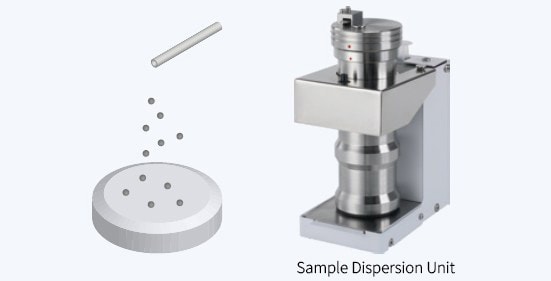
-
Setting Test Conditions
Select single test or continuous test, and set the following as the test conditions:
• Test mode
• Test force
• Loading speed
• Test end conditions 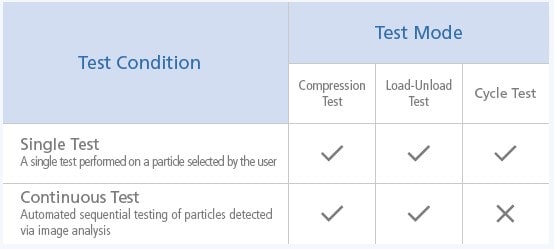
-
Particle Detection
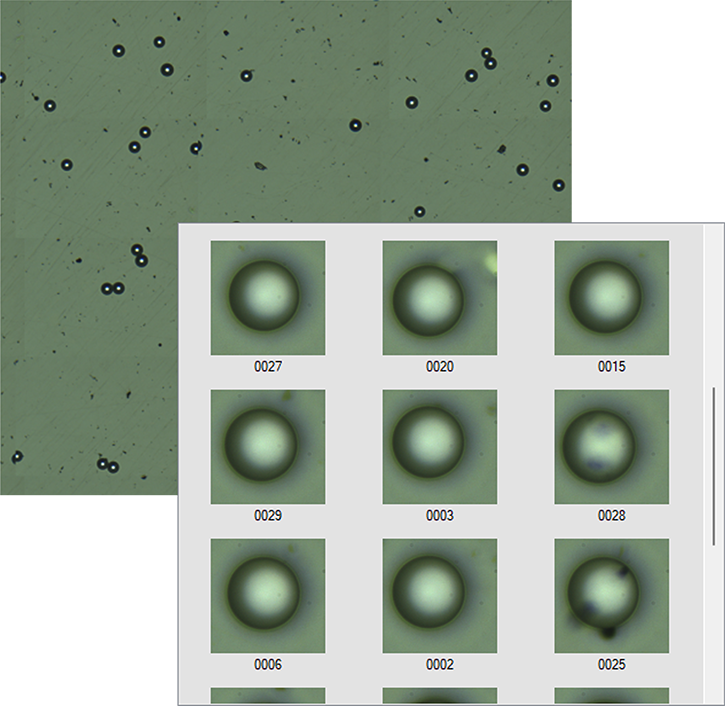
Wide-Area Scan
Images of the compression plate captured from above using a low-magnification lens are stitched together to create a wide-area image of up to 10 × 10 mm, from which the particles are detected.
Length Measurement
Automatic Length Measurement
The detected particles are imaged with a high-magnification lens, and their diameters are measured.
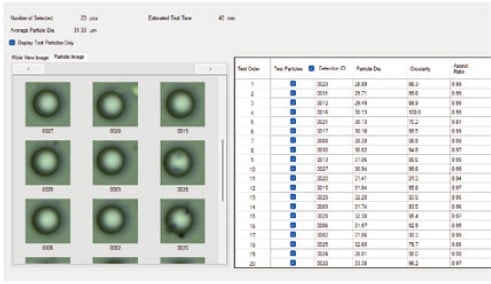
Preparation of Test List
Determining the Test Particles
A test list is prepared by extracting up to 100 particles that are close to the ideal test target determined from the particle size, circularity, and particle images.
Test
-
Performing the Test
When the Test Start button is pressed, the electric XY slide stage moves, and the test is performed in accordance with the test list.
Cleaning the Indenter
The indenter is automatically cleaned when each test is completed.
Analysis
-
Review of Test Results
Test results are reviewed based on graph profiles and post-test particle images, and the data to be used for analysis are selected. Results close to the average or median values of particle size and strength can be extracted.
Report Output
A report can be generated that includes graphs as well as the average values and standard deviations of the selected test results (test force, displacement, and strength).
Performing a Variety of Physical Property Tests
Performing a Variety of Physical Property Tests
(Test items can be selected according to the application)
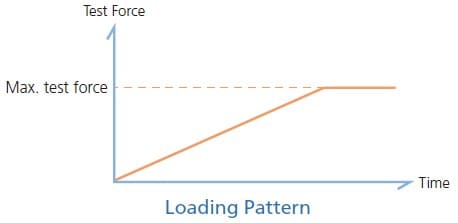
Compression Test
-
In this test, when the sample shape is set to particle or fiber, a load is applied up to the set test force. If the sample breaks (fractures), the crushing strength is determined, and if the sample does not break, the strength at the specified deformation is obtained. If other sample shapes are selected, the test ends once the load reaches the set test force.
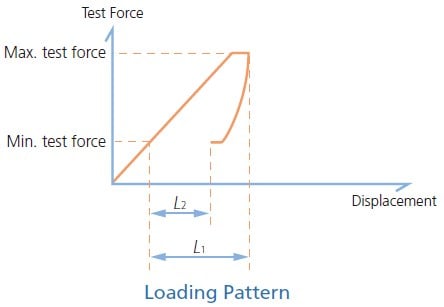
Load-Unload Test
-
In this test, a load is applied up to the maximum test force and then unloaded to the minimum test force.
Cycle Test
-
In this test, the load-unload test is repeated up to 250 times. This test is used to evaluate the properties of a sample under cyclic loading.
Note: Not supported by the AD model. 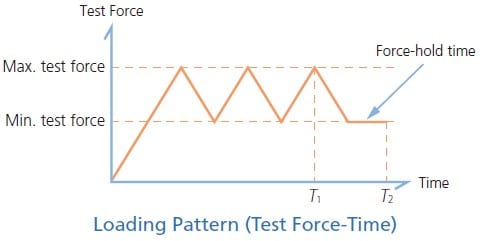
Comprehensive Analysis Functions Facilitate Compressive Property Evaluation
-
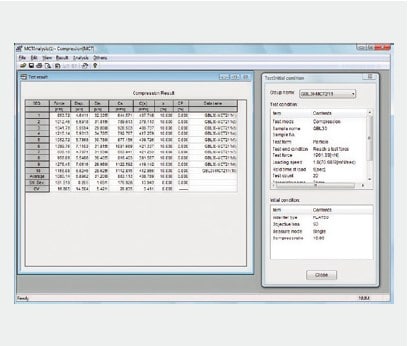
Display of Test Force, Displacement, and Strength
Individual test results (test force, displacement, strength, etc.), their average values, and the associated test conditions can be displayed.
-
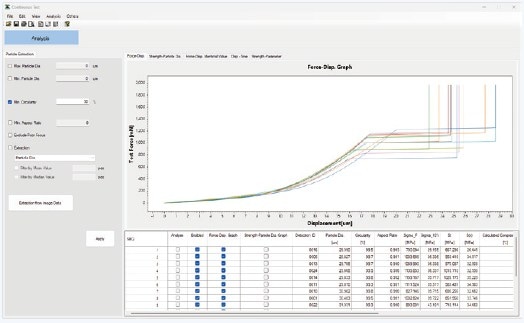
Superimposed Test Force-Displacement Curves
Plotting multiple test force–displacement curves simultaneously allows differences in deformation properties to be identified at a glance.
The curves can also be superimposed starting from the same origin.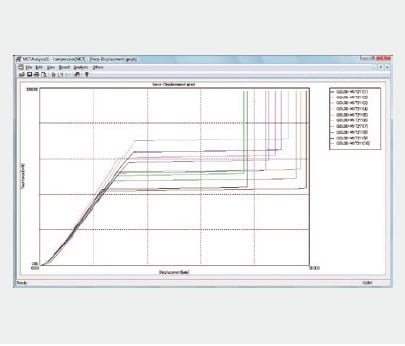
-
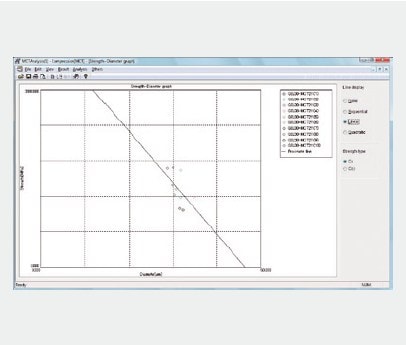
Strength-Particle Diameter Curve
The relationship between particle size and strength can be displayed on a graph.
-
Displacement-Time Curves
After the indenter has reached the sample surface, information can be obtained regarding the sample deformation resistance as it deforms.
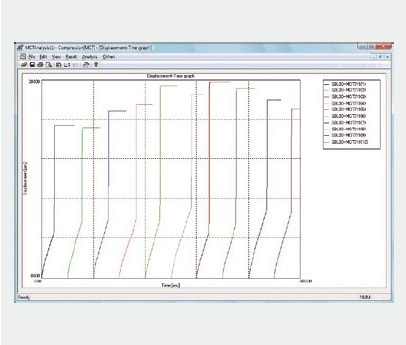
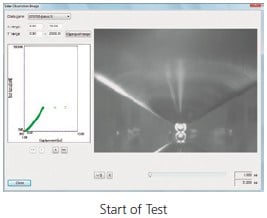
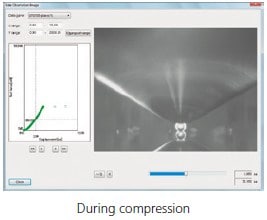
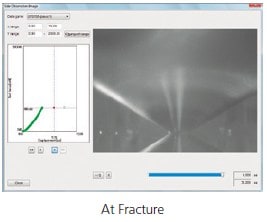
Image Observation during Compression
The following shows a glass bead of approximately 30 μm being compressed with a 50μm diameter of flat indenter.
Left window: Test force and displacement measurement data
Right window: Side observation data
A side observation image is displayed for any point in the measurement data.