


HyperVision HPV-X3 - Applications
High-Speed Video Camera

Most of the documents on the LITERATURE is available in PDF format. You will need Adobe Acrobat Reader to open and read PDF documents. If you do not already have Acrobat Reader, you can download it free at the Adobe's Website. Click the GET ADOBE READER icon on the left to download a free copy of Adobe Acrobat Reader.
Material
DIC Analysis for High-Speed Tensile Testing of CFRPs
-
Both static and dynamic material properties, such as impact characteristics, are important for understanding the behavior of materials. Carbon fiber reinforced plastics (CFRPs) exhibit brittle fracture behavior with fracture progression that occurs instantaneously upon damage, and observing this phenomenon requires high-speed video cameras with excellent recording speeds and resolution. The improved resolution of the image sensor in the HPV-X3 improves camera performance for DIC analysis.

-
Recording speed: 20 Mfps, Test speed: 10 m/s, Specimen width: 12 mm
DIC Analysis in High-Speed Tensile Testing of Notched Polymer Specimens
-
Strain concentration was observed at the notch, and a decrease in strain was detected at the time of fracture.

-
Recording speed: 5 Mfps, Field of view width: approx. 25 mm
DIC Analysis of Impact Compression Test Using the Hopkinson Bar Method with HPV-X3
-
The impact compression test of an aluminum alloy using the Hopkinson bar method was recorded, and DIC analysis was conducted using the captured images.


-
Recording speed: 0.5 Mfps, Field of view width: approx. 15 mm
Impact Compression Test of an Acrylic Block Using the Hopkinson Bar Method
-
Using the Hopkinson bar method, an impact compressive load was applied to an acrylic block, and the propagation of cracks and the fracture behavior were captured.
The acrylic block has a central circular hole with a diameter of 2 mm. It was observed that cracks propagate laterally from this hole, and additional diagonal cracks form, ultimately leading to fracture.

-
Recording speed: 5 Mfps, Field of view width: approx. 15 mm
3D-DIC Analysis in Compression Test of Glass Tube
-
Strain distribution in a glass tube under compression was visualized by 3D-DIC analysis using two HPV-X3 cameras. Observation of fracture behavior in brittle materials such as glass requires high-speed cameras with frame rates of several Mfps.

-
Recording speed: 5 Mfps, Field of view width: approx. 50 mm

Imaging courtesy of Graduate School of Engineering, Tohoku University, Center for Advanced Research of Materials Strength Science, Division of Next-Generation Energy Systems
Observing Crack Progression During Ring-on-Ring Testing of Glass
- Ring-on-ring testing was performed on reinforced glass and images were captured of the cracks that occurred during failure. (Reference standard: ASTM C1499)

Recording speed: 10 Mfps, Field of view width: approx. 45 mm
High-Speed Imaging of Arc Behavior in Lightning Strike Tests
-
To mitigate lightning strike damage to aircraft materials, understanding the
damage mechanisms is crucial. Here, high-speed imaging was performed on an
aluminum thin wire during an arc entry test simulating a real lightning event,
allowing observation of the lightning current progression and the plasma formation and vaporization of the aluminum wire caused by the strike.

-
Recording speed: 20 Mfps, Field of view width: approx. 50 mm
Imaging courtesy of Strategic Planning Division, Japan Aerospace Exploration Agency (JAXA)
Observing Blast and Shock Waves During Detonation of Micro-Explosives
- A silver azide pellet was detonated with a laser and the resulting blast and shock wave propagation was visualized in Schlieren images. The shock wave propagated around the blast wave and its reflection was visualized clearly in an aluminum alloy plate.
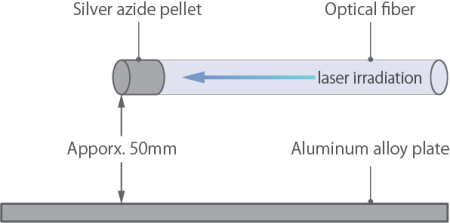
Recording speed: 1 Mfps, Field of view width: approx. 250 mm
- Images of the area around a silver azide pellet during detonation were captured at 20 Mfps. The images captured a blast wave that appeared approx. 450 ns after laser irradiation of the pellet, which was followed by the progression of a shock wave around the blast wave.
Recording speed: 20 Mfps, Field of view width: approx. 5 mm
Images captured by: Specially Appointed Associate Professor Kiyonobu Otani, Institute of Fluid Science, Tohoku University
Observing Shock Waves Using the Schlieren Method
-
Shock waves generated by a pellet launched from a gas gun were captured using the Schlieren method.
Two rubber bands placed along the pellet trajectory allowed the reflection of the shock waves to be observed.
-
Recording speed: 0.87 Mfps, Field of view width: approx. 100 mm
Life Science
-
Expansion and Contraction of Bubbles in Polyvinyl Alcohol (PVA) Gel
Images were captured of bubbles being formed while PVA gel was irradiated with a laser. Bubbles were observed to repeatedly expand and contract inside the gel. Images captured by the camera show the progression of shock waves produced when the bubbles were formed and collapsed. -
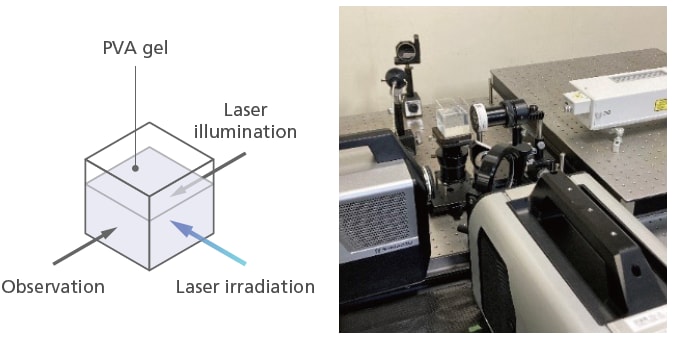
-
Bubble Formation
Recording speed: 20 Mfps, Field of view width: approx. 75 mm -
Bubble Collapse
Recording speed: 20 Mfps, Field of view width: approx. 20 mm
Images captured by: Associate Professor Tokitada Hashimoto, Department of Mechanical Engineering, Faculty of Science and Engineering, Saga University
Observation of Shock Waves in Shock Tubes
-
The shock wave generated when releasing air at eight times atmospheric pressure was captured using a Mach-Zehnder interferometer. The shock tube consists of a driver section, a driven section, a supersonic nozzle, and a needle. A plastic diaphragm is placed between the driver and driven sections, and during the test, the diaphragm is ruptured using the needle to generate the shock wave.
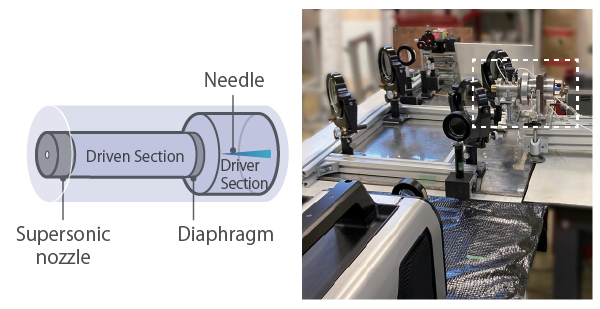
-
Recording speed: 1 Mfps
Images captured by: Associate Professor Tokitada Hashimoto, Department of Mechanical Engineering, Faculty of Science and Engineering, Saga University
Observing the High-Frequency Oscillation of Microbubbles
-
Images were captured of microbubbles that formed in water when the water was irradiated and heated locally with a laser. The microbubbles first expanded then contracted and the images show a jet flow that occurs during contraction as the bubble disappears.
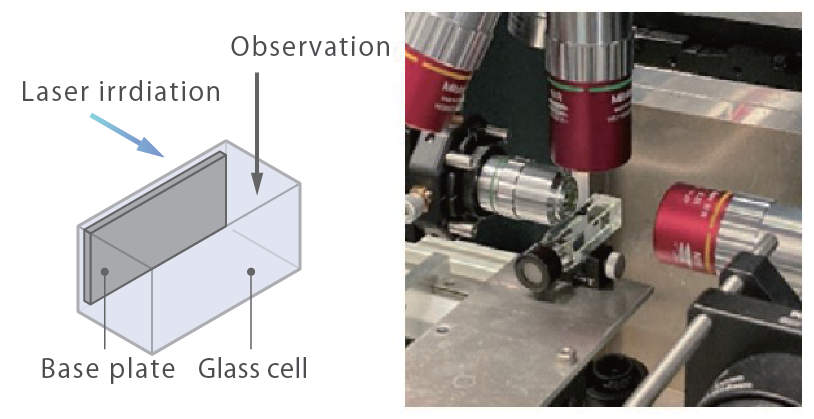
-
Recording speed: 20 Mfps, Field of view width: approx. 110 um
Images captured by: Associate Professor Kyoko Namura, Department of
Micro Engineering, Graduate School of Engineering, Kyoto University