| Description | Q'ty |
|---|---|
| FTIR Spectrophotometer, IRTracer-100 | 1 |
| IRPCSET,FL,D588B,W10 | 1 |
| PRINTER,TR703 | 1 |
| Quest ATR | 1 |
| QuestATR ZnSe | 1 |
| Description | Q'ty |
|---|---|
| FTIR Spectrophotometer, IRTracer-100 | 1 |
| IRPCSET,FL,D588B,W10 | 1 |
| PRINTER,TR703 | 1 |
| PRINTER,TR703 ATR-8200H | 1 |
Fourier Transform Infrared Spectrophotometer
| Description | Q'ty |
|---|---|
| FTIR Spectrophotometer, IRTracer-100 | 1 |
| IRPCSET,FL,D588B,W10 | 1 |
| PRINTER,TR703 | 1 |
| Quest ATR | 1 |
| QuestATR ZnSe | 1 |
| Description | Q'ty |
|---|---|
| FTIR Spectrophotometer, IRTracer-100 | 1 |
| IRPCSET,FL,D588B,W10 | 1 |
| PRINTER,TR703 | 1 |
| PRINTER,TR703 ATR-8200H | 1 |

Most of the documents on the LITERATURE is available in PDF format. You will need Adobe Acrobat Reader to open and read PDF documents. If you do not already have Acrobat Reader, you can download it free at the Adobe's Website. Click the GET ADOBE READER icon on the left to download a free copy of Adobe Acrobat Reader.
A UV-curable resin such as acrylate can be hardened (cured) relatively quickly through the process of radical polymerization, which is accomplished by irradiating the material with ultraviolet light. Although the curing process proceeds relatively slowly if a typical indoor fluorescent light source is used, a powerful commercial UV lamp provides much stronger ultraviolet irradiation permitting nearly complete curing in a matter of seconds. To keep up with these very fast reactions, it is necessary to use an FTIR equipped with high-speed scanning capability. The rapid scan feature of the IRTracer-100 FTIR permits acquisition of 20 infrared spectra per second, enabling precise observation of the curing reaction process even when it is completed within a few seconds.
Using the Shimadzu IRTracer-100 FTIR spectrophotometer Rapid Scan feature, we introduce the results of measurement of the curing reaction process that occurs in UV-curable resin.
Using the specular reflectance method, we conducted measurement of the infrared spectra generated during the curing process of commercially available acrylatebased UV-curable resin which was coated on a metal plate in a thin layer.
After conducting background measurement using the metal plate as the reference, a layer of sample that was thin enough to avoid peak saturation was coated on the metal plate. Measurement was started in the Rapid Scan Measurement mode at an acquisition rate of 20 spectra per second, and after 5 seconds, ultraviolet irradiation was begun.
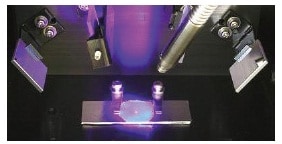
UV-Irradiation for Sample
A 1- second excerpt of the infrared spectrum measurement results is shown as a 3D graph in Fig. 1.
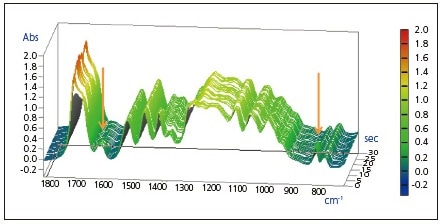
Fig.1 3D Spectra of Rapid Scan Measurement Generated in Curing Reaction in UV-Irradiated Resin
Also, the expanded spectra of the peaks near 1635 cm-1 and 810 cm-1 acquired over approximately 2 seconds directly following UV irradiation are shown in Figs. 2 and 3. It is believed that the peaks at 1635 cm-1 and 810 cm-1 are associated with the C=C stretching vibration of the vinyl group and the CH out-of-plane bending vibration of the vinyl group, respectively. It is evident that an abrupt decrease in the vinyl group occurred following UV irradiation.
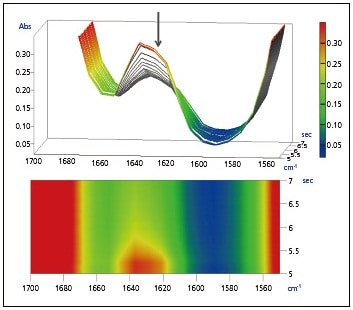
Fig. 2 Expanded Spectra of Peak at
1635 cm-1, Upper: 3D, Lower: 2D
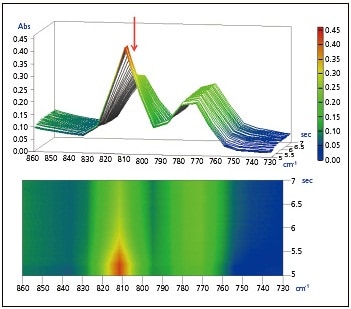
Fig. 3 Expanded Spectra of Peak at
810 cm-1, Upper: 3D, Lower: 2D
Fig. 4 shows the peak area time course graphs of the peaks at 1635 cm-1 and 810 cm-1. During the few seconds directly following UV irradiation, a dramatic reduction in the sizes of these peaks is clearly noticeable.
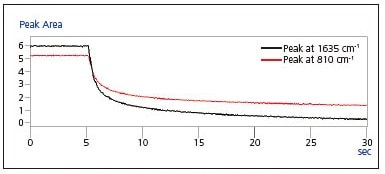
Fig. 4 Peak Area Time-Course Graph of Peaks at
1635 cm-1 and 810 cm-1
Using the peak area value of the peak at 1635 cm-1, Fig. 5 shows the reaction rate time-course graph assuming a reaction rate of 0 % prior to UV irradiation, and a 100 % reaction rate at the point the peak disappears, or in this case, at the completion of the curing reaction. The graph clearly indicates that the reaction was more than 50 % completed in less than one second, and reached 80 % completion in about 5 seconds, after which the reaction progressed slowly.
This type of reaction rate calculation is one example of the type of the analytical functions included in the Rapid Scan measurement software.
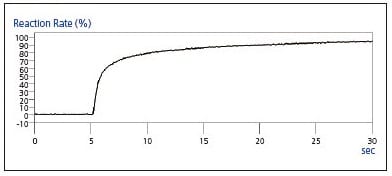
Fig. 5 Time-Course Graph of Reaction Rate
The FTIR-Rapid Scan effectively tracks chemical reactions and changes that progress very quickly, permitting close observation of the reaction process.
Commercially available plastic products contain polymers, such as polyethylene (PE) and polypropylene (PP), as their main components, in addition to various t race component s that are added to enhance performance and maintain quality. Here we introduce an evaluation of additives used in plastic bags taking advantage of the high SN ratio of the Shimadzu FTIR IRTracer-100 spectrophotometer.
Single reflection ATR is commonly used as an infrared spectroscopy method for easy, non-destructive evaluation of additives in plastic products. Because measurement can be conducted without the need for pretreatment of the sample, the single reflection ATR method is widely used in various applications, including contaminant identification.
Using the single reflection ATR method, we measured the surface of commercially available plastic bags.
The results obtained from analysis of the plastic bag are consistent with the library spectrum of polyethylene, indicating that the principal component is polyethylene. Fig. 2 shows an expanded view in the vicinity of the baseline of Fig. 1. It is believed that the arrow-indicated peaks in the figure are derived from additives present in the plastic bags, and these are consistent with the spectra of aliphatic amides such as oleamide. Aliphatic amides are one type of substance added to resins to serve as a lubricant.
The peaks associated with the aliphatic amide that appeared in the measurement results of Figs. 2 and 3, respectively, show very weak intensity with absorbance values less than 0.010 A. Also, there is a peak in the vicinity of 1631 cm-1, a region that easily reflects the presence of water vapor in the air. Deeming that purging the measurement system with dry air or nitrogen gas was unnecessary led to the clear detection of these minute peaks.
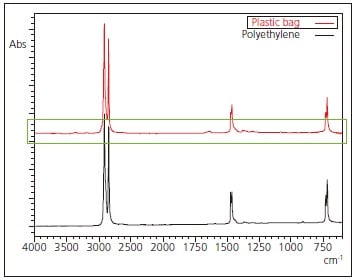
Fig. 1 Infrared Spectrum and Search Result for Plastic Bag
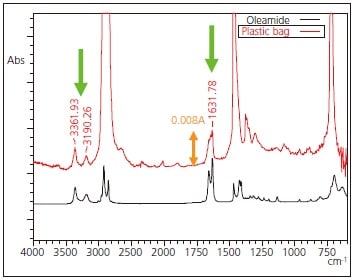
Fig. 2 Expanded Infrared Spectrum of Figure 4 and Spectrum of Oleamide
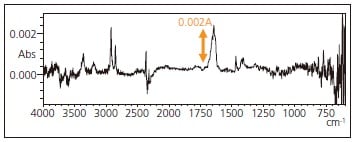
Fig. 3 Infrared Spectrum of Substance Transferred to ATR Prism
It is generally possible to gain an understanding of content level using the height and area value of the peak originating from the target component, but for small peaks derived from additives, it is important to grasp the measurement repeatability. Ten continuous repeat measurements were taken with a plastic bag sample in close contact with the ATR prism. The peak area values of the peak in the vicinity of 1631 cm-1 and the calculated CV values are shown in Fig. 4.
* The displayed area values represent normalized values based on the average of 10 repeat measurements.
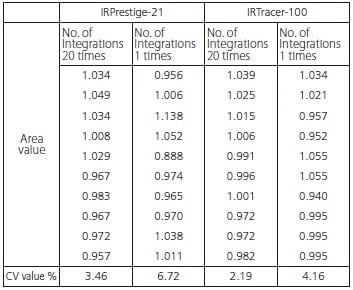
Fig.4 Peak Area and CV Values
The high S/N ratio of the Shimadzu FTIR IRTracer‑100 enabled stable and clear acquisition of minute peaks originating from additives present at minute levels.