What is Particle Size Analysis?
Powder is an aggregate of many particles. The particles that make up a powder can be small or large and vary in size and amount.
Soil is also aggregates of particles. One of the common particle size analyses is for soil particles. The type of soil is classified according to the particle size, such as "sand" or "clay.“ Fig.1 shows the soil classification based on the particle size. Soil classification is one of the important indicators for evaluating the strength of the ground.
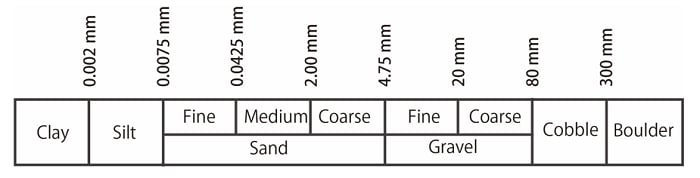
Fig.1 Soil Classification Based on Particle size
(Ref: IS: 1498 - 1970)
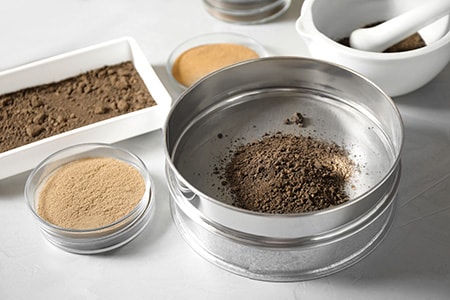
In the soil particle size test, sedimentation analysis is performed for soil smaller than a given size, and measurement using sieves of various sizes is performed for soil larger than a given size. Soil particle tests use different sizes of sieves and measure the mass of soil remaining (or passing) on each sieve. Fig. 2 shows results for soil particle size tests using sieves of several sizes, placing particle size on the x-axis and the amount of particles passing through on the y-axis. The results show that soil A is mainly composed of fine-grain sand and soil B is composed of a wider range of particle sizes.
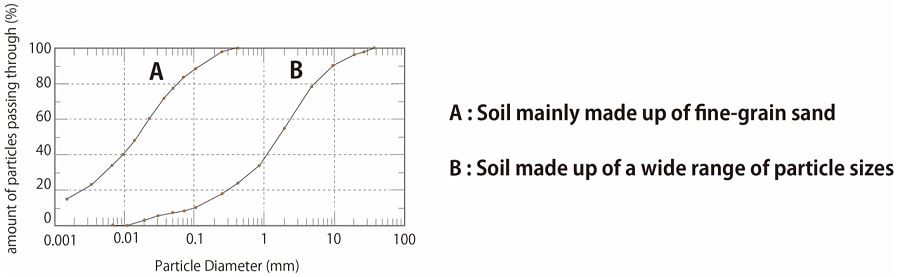
Fig.2 Results of Soil Particle Size Test Using Sieves of Several Sizes
Fig. 3 shows the histograms of the particle sizes that make up each sample. The image on the left side of Fig. 3 shows that the orange particles representing soil A are completely smaller in distribution than the green particles representing soil B.
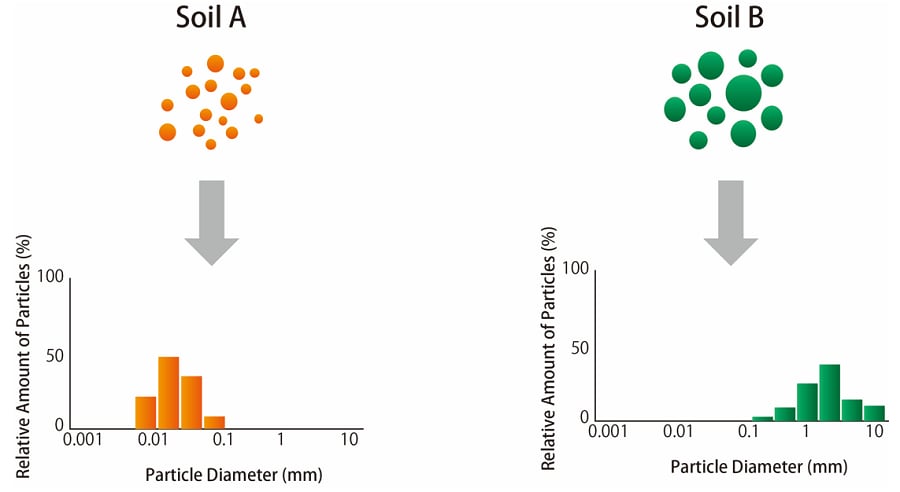
Fig.3 Histograms of the Particle Sizes for Two Soil Samples
In general, the data obtained by particle size analysis includes these two sets of data. Fig.4 shows an example of particle size analysis with the particle size on the x-axis and the relative amount of particles on the y-axis. The vertical axis on the left indicates the scale of the cumulative size distribution. Cumulative undersize distribution (indicated by the red line) expresses the percentage of specific particle sizes, starting at 0% on the fine side and ending at 100% on the coarse side. The vertical axis on the right indicates a frequency distribution scale. The histogram (indicated by the blue bars) represents the percentage of particles present in each particle size fraction.
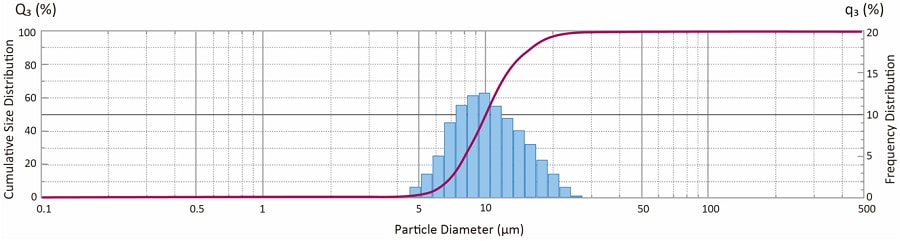
Fig.4 Typical Data Example of Particle Size Analysis