Utilization of Diffracted/Scattered Light Intensity Distribution Data - Part 2
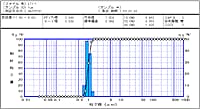
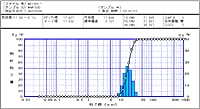
When the distribution width of the particle size distribution to be measured is relatively narrow, the first peak appears clearly in the light intensity distribution data, as shown in Fig. 1.
The position (or, the No. of the sensing element in the sensor) of this first peak has an almost 1:1 correspondence relationship with the average particle size. In other words, the position of the first peak changes according to the average size of the particles to be measured, though this hardly affects the refractive index of the particles to be measured. If multiple samples to be used as the reference are measured in advance to investigate the "correspondence relationship between the first peak and average particle size," this relationship can be used as a means for verifying the appropriateness of the particle size distribution measurement results. Namely, this relationship becomes a means for averting the risk of inappropriate measurement results due to having selected a unsuitable refractive index.
This "correspondence relationship between the first peak and average particle size" is dependent on the optical system of the laser diffraction particle size analyzer, in particular, the focal distance of the condenser lens and the shape of the diffracted/scattered light sensor. Consequently, this relationship will be different if the model is different.
Also, a clear first peak will no longer be obtainable near the lower or upper limits of the measuring range. And, when the distribution width of the particle size distribution to be measured is fairly broad, a clear first peak cannot be obtained. Note that, in these cases, the appropriateness of the measurement result will no longer be verifiable using the "correspondence relationship between the first peak and average particle size."
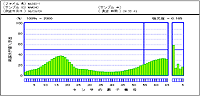
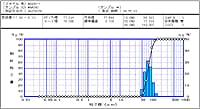
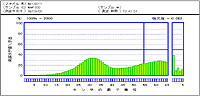
Figs. 2 to 5 show examples of the "correspondence relationship between the first peak and average particle size" on the SALD-2100.
* Click to enlarge the figure.
↓
↓
↓
↓