Near-Infrared Region Measurement and Related Considerations Part 1
What is NIR?
Near-infrared (NIR) light refers to wavelengths from 800 to 2500 nm (12,500–4,000 cm-1). It sits just beyond visible light and is commonly used in material analysis due to its ability to measure broad overtone and combination bands of some of the fundamental vibrations.
This article introduces key characteristics of NIR absorption and practical considerations in transmittance measurement, especially with FTIR spectrophotometers.
How FTIR performs near-infrared measurements
Fourier Transform Infrared spectrophotometers (FTIR) are mainly used to measure light absorption of so-called mid-infrared light, light in the wavenumber range of 4,000 to 400 cm-1 (wavelengths 2.5 to 25 µm), in order to identify and quantify various materials. By modifying the FTIR's interferometer beam splitter and detector to accommodate near-infrared light, FTIR spectrophotometers that can be used for near-infrared light measurement have been developed and commercialized.
Differences between NIR and MIR absorption
Measurement of near-infrared light is different in some ways from that of mid-infrared light, and some of the characteristics and considerations associated with near-infrared light absorption should be noted. Here we introduce some actual sample measurement examples to illustrate points that should be considered.
1. Characteristics of Near-Infrared Light Absorption
Near-infrared light generally refers to light within the wavenumber range of 12,500 to 4,000 cm-1 (wavelengths from 800 to 2,500 nm) (see Fig. 1). Absorption of near-infrared light, like that of mid-infrared light, is based on the vibration of the material.

Figure 1 Near-Infrared Light Region
However, near-infrared light absorption is much weaker in intensity as compared with mid-infrared light absorption, since near-infrared light absorption is based on overtones and combined tones in the mid-infrared light region. Therefore, measurement of samples showing weak absorption is difficult, but the fact that samples can be measured without being diluted is an advantageous feature.
Furthermore, as solvents themselves show weak absorption, aqueous solutions are also relatively easy to measure.
Various methods of near-infrared absorption measurement are known, such as the transmittance and diffuse reflectance methods, and these will be introduced using measurement examples.
2. Near-Infrared Transmittance Measurement of Liquids
- Water absorbs strongly in MIR, but less in NIR
- NIR allows easier detection of solutes in aqueous solutions
- Glass and quartz can be used as windows in NIR due to minimal absorption
Measurements that are often conducted in the near-infrared region include the transmittance measurement of solutions. There are a variety of measurement samples that fall into this category, and aqueous solutions are one type. As is commonly known, the molecular extinction coefficient of water in the mid-infrared region is extremely large, and in most cases saturation occurs in absorption associated with the solvents. Therefore, there are many instances where the absorption associated with other substances cannot be confirmed. In contrast, when a 1 mm path length cell is used to conduct near-infrared transmittance measurement, in almost all regions, the absorption of substances present in the water can be confirmed (although this can be difficult at low concentrations).
In addition, in the near-infrared region, as in the visible region, the absorption of glass and quartz is barely seen. Therefore, chemically stable and easy-to-handle glass and quartz can be used as materials for window plates and cells for measurement.
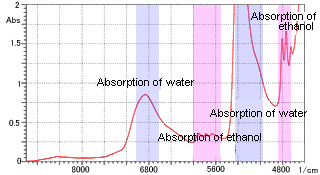
Figure 2 Ethanol Aqueous Solution Measurement
As an example of aqueous solution measurement, Figure 2 shows the near-infrared spectrum of an ethanol aqueous solution. A cell with a path length of 1 mm was used. The absorption of water along with that of the dissolved ethanol was clearly confirmed. Thus, measurement of an aqueous solution, which is difficult in the mid-infrared region due to absorption saturation, is relatively easy in the near-infrared region.
3. Temperature Effects on Absorbance
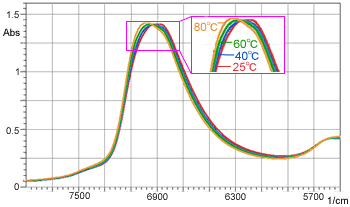
Figure 3 Changes in Peak Wavenumber of Water due to Temperature
In measurement of this type of aqueous solution and samples with high water content, it is necessary to consider the factor of temperature. Figure 3 shows the spectra of water acquired at different temperatures between 25 and 80 °C.
It is clearly seen that, as the temperature increases, the peak around 7,000 cm-1 shifts toward the higher wavenumber side. Table 1 shows the absorbance values with respect to temperature changes at 6,890 cm-1 (peak position at 25 °C).
Table 1: Temperature and Absorbance of Water at 6,890 cm-1
| °C)Temperature |
Absorbance |
| 25 | 1.418 |
| 40 | 1.403 |
| 60 | 1.390 |
| 80 | 1.372 |
Tip: For accurate NIR measurements of water-containing samples, maintain consistent temperature conditions.
Thus, it can be seen that as the temperature changes, the absorbance also changes in accordance with the wavenumber shift. For this reason, in near-infrared measurement of samples that contain water, absorbance around water absorption will fluctuate unless measurement is conducted at a constant temperature.
The main cause of peak shift shown here is said to be temperature-induced changes in the hydrogen bond of the water molecules.
Just to touch on the topic of the change in the hydrogen bond, in the near-infrared region, since there is a big difference in the peak positions of the hydrogen-bonded OH group and the non-hydrogen-bonded OH group, and since the peak intensity of the non-hydrogen-bonded OH group is relatively large, measurement is often conducted with respect to the hydrogen bond (Shimadzu Application News No. A365).
4. Near-Infrared Transmittance Measurement of Solids
Up to here, we have spoken about the near-infrared transmittance measurement of liquids; however, the near-infrared transmittance method is also effective for measuring solids. Figure 4 shows a near-infrared transmittance spectrum of 1 mm thick polystyrene. It is clear that in near-infrared measurement, there is almost no saturation in the absorption of the 1 mm thick sample. A mid-infrared transmittance spectrum of a polystyrene sample having the same 1 mm thickness is shown in Figure 5. Here, the absorption saturation is evident. In measurement of solids, as shown here, samples of thickness that would be accompanied by absorption saturation in mid-infrared transmittance measurement can be measured without absorption saturation in the near-infrared region.
Table 2: Comparison of NIR and MIR Spectra for Polystyrene Sample (1 mm)
| Spectrum Type | Observation |
| NIR | Clear peaks, no saturation |
| MIR | Small peaks are emphasized, saturation visible |
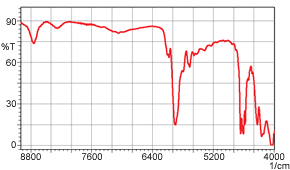
Figure 4 Near-Infrared Spectrum
(1 mm thick polystyrene)
Figure 5 Mid-Infrared Spectrum
(1 mm thick polystyrene)
5. Comparison with UV-Vis-NIR Spectrophotometer
Key Difference
- FTIR offers higher spectral resolution than UV-Vis-NIR, but UV-Vis-NIR provides better repeatability of absorbance values.
Ultraviolet-visible near-infrared (UV-Vis-NIR) spectrophotometers are also capable of measuring near-infrared spectra. However, the construction of UV-Vis-NIR spectrophotometers is different from that of FTIR spectrophotometers, and there are differences in data obtained by these two types of instruments.
Following are examples of o-xylene transmittance measurement. The measurement results using the FTIR are shown in Figure 6, and the measurement results using the UV-Vis-NIR Spectrophotometer are shown in Figure 7. The horizontal axis shows the wavelength to facilitate comparison.

Figure 6 o-Xylene Near-Infrared
Transmittance Spectrum (FTIR)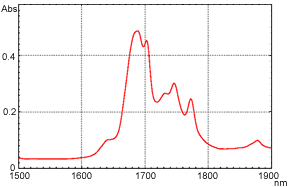
Figure 7 o-Xylene Near-Infrared Transmittance Spectrum
(UV-Vis-NIR Spectrophotometer)
6. Conclusions
Here we introduced characteristics and points to consider with respect to transmittance measurement in the near-infrared region.
Next, we will introduce methods of measurement other than the transmittance measurement method.
FAQ
What does wavenumber mean in FTIR?
A wavenumber refers to the number of wave cycles per centimeter (cm-1) and is used to represent infrared light frequencies. It’s inversely related to wavelength and is commonly used in FTIR to identify molecular vibrations.
What is the difference between FTIR wavelength and wavenumber?
Wavelength measures the distance between peaks of light waves (in µm or nm), while wavenumber measures how many wave cycles fit in one centimeter. They describe the same phenomenon from different perspectives and are convertible using the formula: wavenumber (cm-1) = 10,000 / wavelength (µm)