Points to Note in Rubber Analysis : Black Rubber
There are many different types of rubber in the world. Broadly speaking, rubber can be classified as either natural rubber or synthetic rubber. A vast majority of the rubber that is sold commercially is classified as synthetic rubber. Synthetic rubbers usually contain many components other than rubber. The substances that are combined with rubber can be broadly classified by their effects as vulcanizing agents, vulcanization accelerators, vulcanization retarders, antioxidants, fillers, and plastics. The machining performance and product performance of rubber products can be altered by changing the combinations and the amounts of these substances. Rubber products appear in almost every aspect of daily life as, for example, the rubber parts used in automobile tires and wipers, raincoats and other types of clothing, the balls that are indispensable for sports such as soccer and rugby, and the packing for home appliances.
In order to obtain infrared spectra for these rubber products, the appropriate pretreatment and measurement methods must be selected in accordance with their color and shape. Here, using actual examples, I will present some points regarding the selection of prisms used to analyze black rubber with the ATR method.
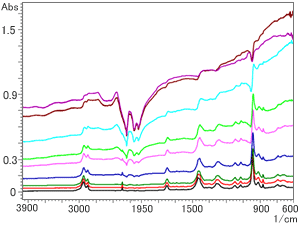
Fig. 1 Spectra of NBR Containing Carbon Method: Single-Reflection ATR (Prism: Diamond)
Here, spectra were obtained for samples containing carbon in amounts ranging from 1 to 50 wt% using three types of prisms, and the spectra were evaluated. NBR (acrylonitrile butadiene rubber) was used as the analyzed rubber material.
Fig. 1 shows an overlay of spectra obtained for NBR containing carbon in amounts ranging from 1 to 50 wt% using a diamond prism (refractive index, n = 2.4). From the bottom of Fig. 1, the respective amounts of carbon are 1, 3, 5, 10, 16, 20, 30, 40, and 50 wt%.
It can be seen from Fig. 1 that, as the amount of carbon increases, the spectral baseline rises, particularly at the right end. This phenomenon occurs because carbon has absorbance throughout the entire infrared region and because, with the ATR method, light penetrates to a relatively large depth in the low wavenumber region. (Refer to Q&A in FTIR TALK LETTER Vol. 6 for details.) It can be seen that, if a diamond prism is used, the right end is particularly high for amounts of carbon of 10 wt% or more.
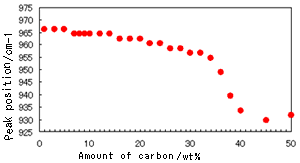
Fig. 2 Peak Shift of C=C-H Out-of-Plane Bending Vibration (Trans-vinylene Group) (Prism: Diamond)
Fig. 2 indicates the relationship between the peak position and the amount of carbon. The peak used for evaluation corresponds to the C=C-H out-of-plane bending vibration (trans-vinylene group) of polybutadiene that is representative of NBR and which exists at 966 cm-1.
It can be seen in Fig. 2 that, when the amount of carbon exceeds 30 wt%, the peak starts to distort, and its position is shifted greatly toward the low wavenumber region. In addition, it can be seen that, if a diamond prism is used, there is a downward peak in the neighborhood of the range of 2,400 to 2,000 cm-1. (Refer to the neighborhood of the range of 2,400 to 2,000 cm-1 in Fig. 1.) This downward peak represents a reversal of the absorbance of diamond itself (absorbance residue). Although NBR, which was used for analysis on this occasion, has a characteristic nitrile-group peak near 2240 cm-1, if a diamond prism is used, when the amount of carbon exceeds 20 wt%, it becomes difficult to distinguish between the peak and the absorbance residue of the prism, and for amounts of carbon exceeding 40 wt%, the nitrile group is completely hidden by the absorbance residue. (Refer to Fig. 3.)
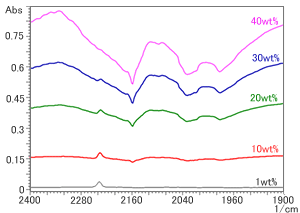
Fig.3 Absorbance Residue of Diamond Prism
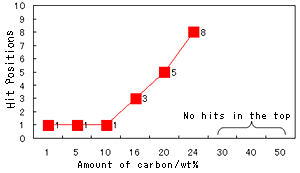
Fig. 4 Hit Positions in Spectral Search
As reference, Fig. 4 shows the results (i.e., the hit positions) of a search for spectra of NBR samples containing different amounts of carbon performed with the Sadtler Database (polymer ATR library). The amounts of carbon contained in NBR that were used in the search were 1, 5, 10, 16, 20, 24, 30, 40, and 50 wt%. (Note that the search algorithm varies with the company. The hit positions should only be used as guidelines.)
It can be seen from this graph that, when the amount of carbon exceeds 10 wt%, the hit position starts to decrease, and for carbon contents of 30 wt% or more, there are hardly any hits at all. (For a carbon content of 30 wt%, there were no hits in the top 200 positions.) Possible reasons for this are (1) the baseline rises at the right end, (2) the peak position is shifted toward the low wavenumber region, and (3) the nitrile group is hidden by the absorbance residue of diamond.
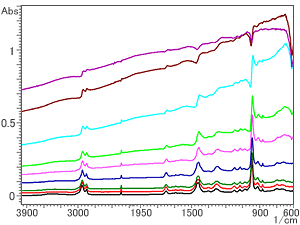
Fig. 5 Spectra of NBR Containing Carbon Method: Single-Reflection ATR (Prism: ZnSe)
Next, the same samples were analyzed using a ZnSe prism with the same refractive index as the diamond prism, 2.4. Fig. 5 shows the spectra obtained. From the bottom of Fig. 5, the respective amounts of carbon are 1, 5, 10, 16, 20, 30, 40, and 50 wt%.
It can be seen from Fig. 5 that, although there is no diamond absorption residue in the neighborhood of the range of 2,400 to 2,000 cm-1, the spectra exhibit the same tendencies as those obtained with a diamondprism, i.e., the rise of the baseline at the right, the shift of the peak position toward the low wavenumber region, and the peak distortion. This is because the refractive indices of the diamond and the ZnSe are almost the same. Therefore, even with a ZnSe prism, accurate qualitative analysis based on searches is possible for amounts of carbon of up to approximately 20 wt%.
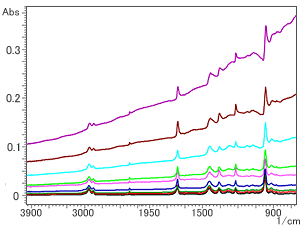
Fig.6 Spectra of NBR Containing Carbon Method: Single-Reflection ATR (Prism: Ge)
Finally, Fig. 6 shows examples of spectra obtained with a Ge prism. From the bottom of Fig. 6, the respective amounts of carbon are 1, 3, 5, 10, 16, 20, 30, 40, and 50 wt%. It can be seen from Fig. 6 that, although the baseline rises at the right as it does with diamond and ZnSe prisms, there is little peak distortion right up to a carbon content of 50 %wt. This is because the refractive index of Ge (n = 4.0) is bigger than that of diamond and ZnSe (n = 2.4). If a Ge prism is used, however, light only penetrates to a relatively small depth compared to diamond and ZnSe prisms, so the intensity of the peaks obtained is lower. (Refer to the vertical axes of Fig. 1 and Fig. 6.)
I also investigated peak shift and the search hit order for the spectra obtained with the Ge prism. The results are shown in Fig. 7 and Fig. 8.
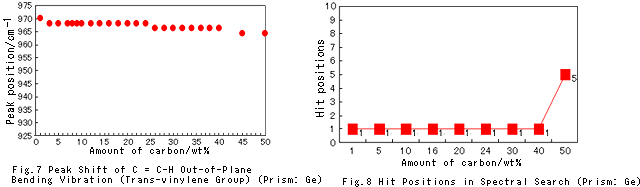
It can be seen that, if a Ge prism is used for analysis, there is hardly any change in peak position. Also, it can be seen from Fig. 8 that, in comparison with analysis performed using a diamond prism, it is easier to get hits.
I performed a search for the Ge prism spectrum obtained for NBR with a carbon content of 50 wt% after subjecting it to multipoint baseline correction. As a result, I got a hit in the first position.
It can be seen, then, that using a Ge prism makes it possible to obtain ATR spectra that are effective for the qualitative analysis of NBR with a carbon content of 50 wt%.
Incidentally, NBR with high concentrations of carbon (i.e., 60 wt% or more) cannot be made because it is impossible to maintain the rubber shapes.