About Resolution, Part 2
Relational Expression between the Resolution, Number of Theoretical Plates, Separation Factor, and Retention Factor
Equation (1) shows the relationship between the resolution (R), number of theoretical plates (N), separation factor (α), and retention factor (k). (This assumes that the two peak widths are equal and k is the retention factor of the rear peak.)

When improving the resolution, what contribution do the number of theoretical plates, separation factor, and retention factor make? The explanations below are based on equation (1).
Number of Theoretical Plates
As the resolution is proportional to the square root of the number of theoretical plates in equation (1), doubling the number of theoretical plates increases the resolution by a factor of √2 ̄= 1.41; increasing the number of theoretical plates four times increases the resolution by a factor of √4 ̄= 2.
Assume that the column used has 10,000 theoretical plates and the resolution between two peaks is 0.8. If the column is replaced to achieve 1.5 resolution (complete separation), what number of theoretical plates is required?
In this case, the resolution must be improved by a factor of 1.5/0.8 = 1.9. Assuming that the separation factor and retention factor remain unchanged, it can be seen that the number of theoretical plates must be increased by a factor of 1.92=3.6, that is, to 36,000. (Fig. 1).
If the same column packing is used, the number of theoretical plates can be increased by extending the column length. In this example, the column length must be increased 3.6 times.
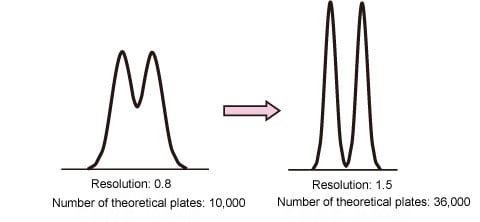
Fig. 1: Number of Theoretical Plates and Separation
However, new UHPLC (ultra high performance liquid chromatography) columns with 2 μm packing particle size now offer a higher number of theoretical plates without increasing the column length. Such columns require an HPLC instrument with a high withstand pressure to handle the increased column pressures.
Separation Factor
The diagram at the left of Fig. 2 shows the effect of the separation factor on the resolution from equation (1), that is, the relationship between α and (α-1)/α. As the separation factor is the ratio of two peak retention factors, it varies due to various conditions, such as the packing stationary phase, mobile phase pH (for analysis of ionic species), type of mobile phase organic solvent, and column temperature. It is apparent from Fig. 2 that, up to about 1.2, the separation factor has an approximately linear relationship to the increase in resolution. If the separation factor was 1.1 at 0.8 resolution in the example introduced above, then the resolution can be increased to 1.5 by setting the separation factor to about 1.2. This is an effective means of improving the resolution. However, it takes some time to optimize the conditions.
Retention Factor
Like the separation factor above, the relationship between k and k/(1+k) is shown in the diagram at the right of Fig. 2. The retention factor increases when a mobile phase with lower elution strength is used. Therefore, the proportion of organic solvent can be reduced in reverse-phase chromatography, for example. However, the diagram at the right of Fig. 2 shows that the retention factor contributes to greater resolution only for peaks that elute quickly. Consequently, increasing the retention factor from 3 to 9, for example, only improves the resolution by a factor of 1.2 but results in longer analysis times.
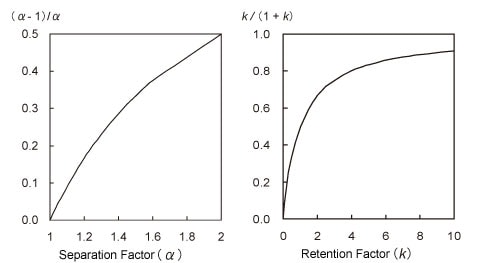
Fig. 2: Relationship of Separation Factor and Retention Factor to Separation
The example above shows that equation (1) gives an understanding of the fundamental concepts required to improve resolution.