Language
Español
English
0

inspeXio™ 7000 - Applications

NUEVO

Sistemas de TC con rayos X con microenfoque

Aplicaciones

Aplicaciones Fecha Fecha de creación
  • Productos electrónicos
  • Automotriz

2025-12-09

  • Energía limpia
  • Automotriz

2025-11-04

  • Materiales de ingeniería

2024-12-10

  • Materiales de ingeniería

2024-10-29

  • Materiales de ingeniería

2024-10-29

  • Automotriz

2024-04-02

  • Alimentos y bebidas

2024-04-02

  • Materiales de ingeniería

2023-12-26

  • Materiales de ingeniería

2023-11-21

  • Automotriz

2023-09-12

  • Productos farmacéuticos y biofarmacéuticos

2022-12-25

  • Automotriz

2022-06-28

  • Productos electrónicos

2022-04-05

  • Energía limpia

2022-04-05

  • Productos químicos
  • Productos cosméticos y de cuidado personal

2022-03-01

  • Materiales de ingeniería

2022-02-03

  • Productos cosméticos y de cuidado personal

2021-11-02

  • Alimentos y bebidas

2021-09-02

  • Productos farmacéuticos y biofarmacéuticos

2021-06-29

  • Materiales de ingeniería
  • Medio ambiente

2021-04-01

  • Alimentos y bebidas
  • Productos químicos
  • Materiales de ingeniería

2021-04-01

  • Materiales de ingeniería
  • Automotriz

2021-03-31

  • Alimentos y bebidas

2021-02-28

  • Alimentos y bebidas
  • Industria de procesamiento de hidrocarburos (Petroquímica)

2020-12-10

  • Productos electrónicos

2020-11-20

  • Productos químicos
  • Materiales de ingeniería
  • Automotriz

2020-10-27

  • Productos químicos
  • Materiales de ingeniería

2020-10-27

  • Productos electrónicos

2020-09-01

  • Automotriz

2020-03-19

  • Productos electrónicos

2020-01-21

  • Productos electrónicos
  • Automotriz

2018-05-28

Leer más
Mostrar menos
adobe

La mayoría de los documentos de la LITERATURA están disponibles en formato PDF. Necesitará Adobe Acrobat Reader para abrir y leer documentos PDF. Si aún no tiene Acrobat Reader, puede descargarlo gratis en el sitio web de Adobe. Haga clic en el ícono OBTENER ADOBE READER a la izquierda para descargar una copia gratuita de Adobe Acrobat Reader.

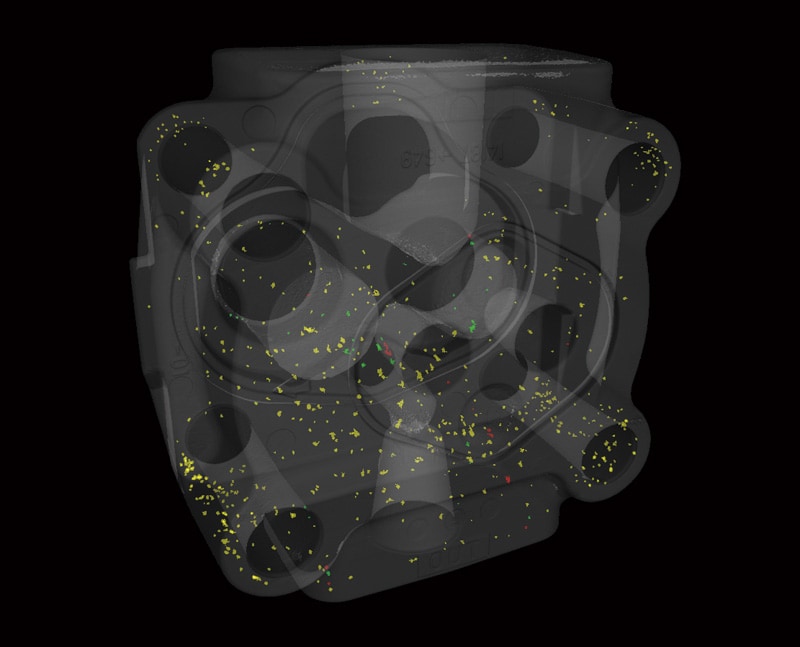
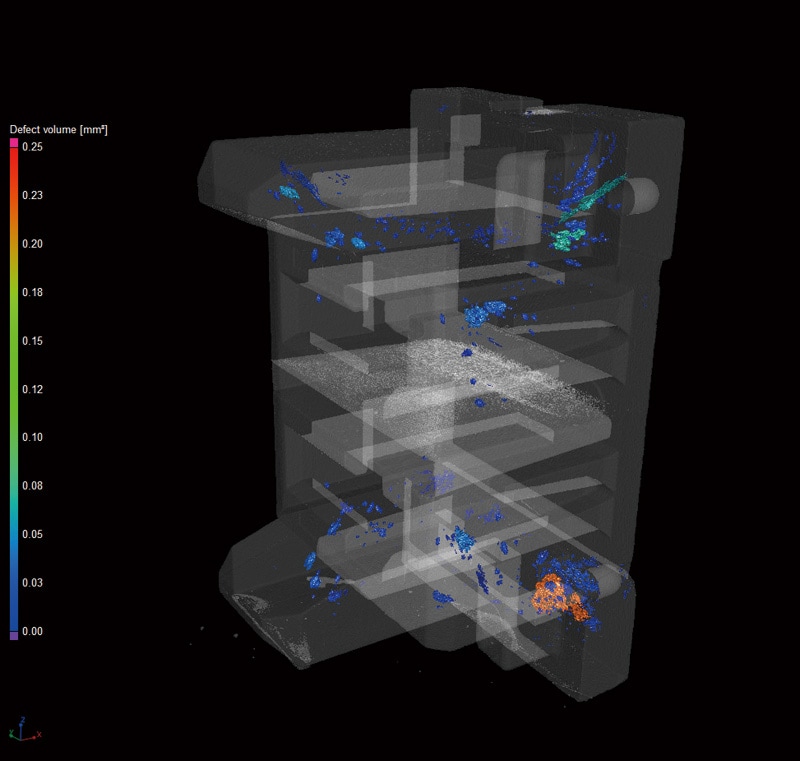
Aluminum Die Castings

muestra
MPR Image
muestra
VR Image
muestra
3D Measurement
 
muestra
Defect Analysis
muestra
Defect Analysis Histogram

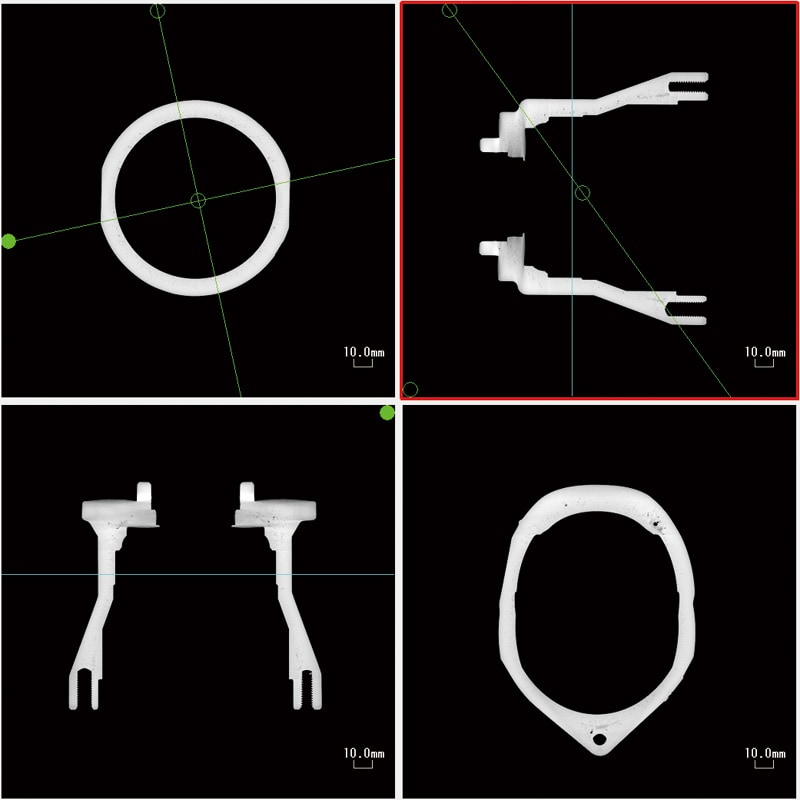
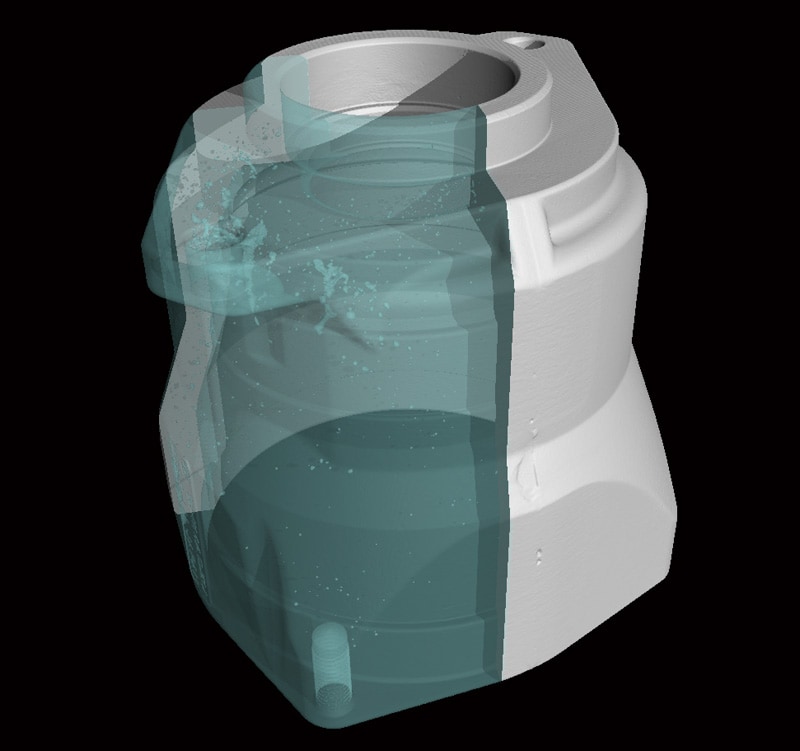
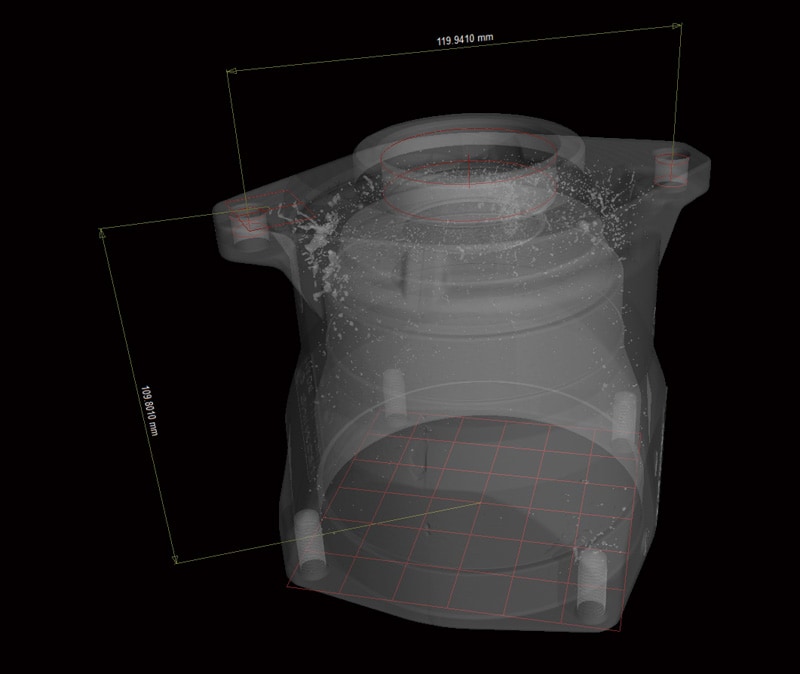
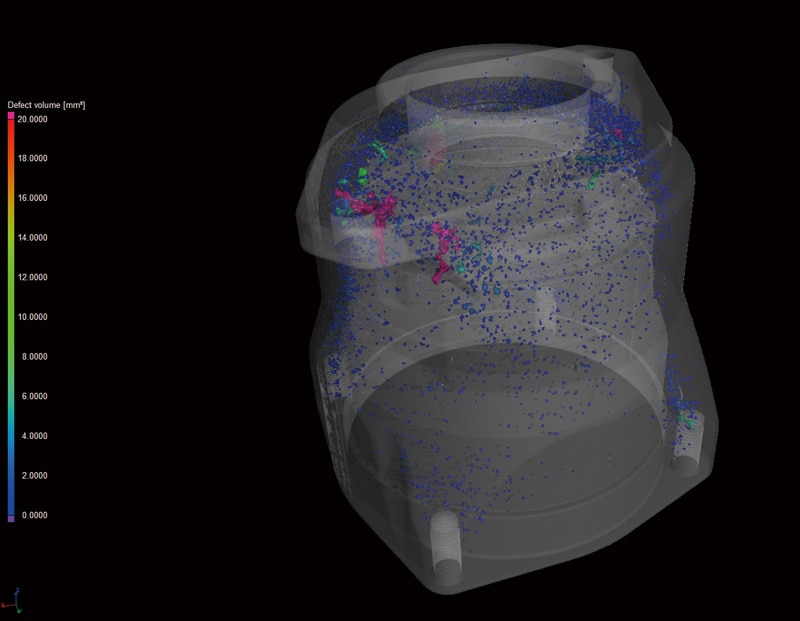
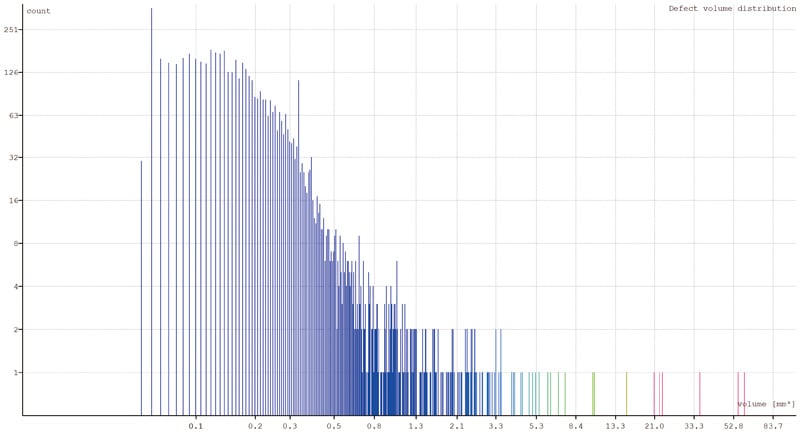
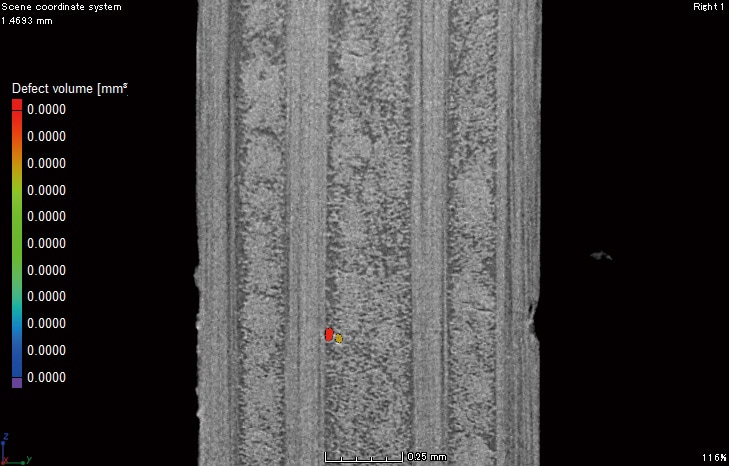
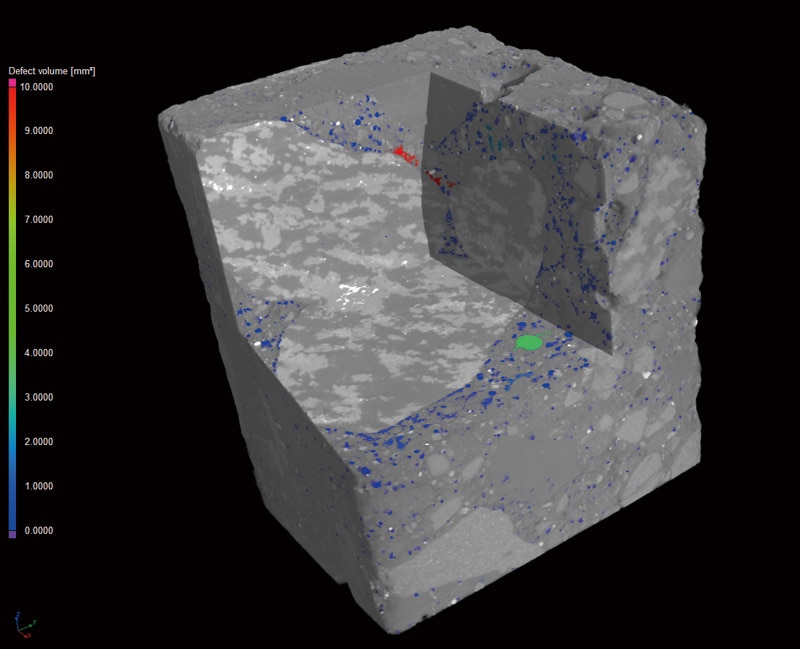
Defect analysis identifies voids and displays a color-coded map of the voids based on their volume. It can also display a frequency histogram of scale the void volume and count.
 
muestra
MPR Image FOV = ø161.5 mm
muestra
Defect Analysis
 

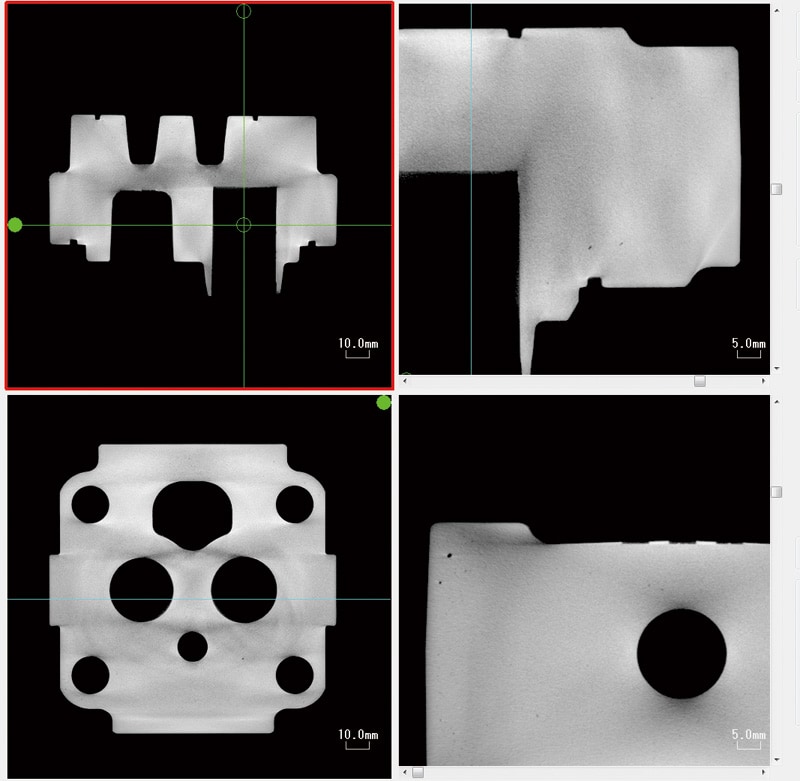
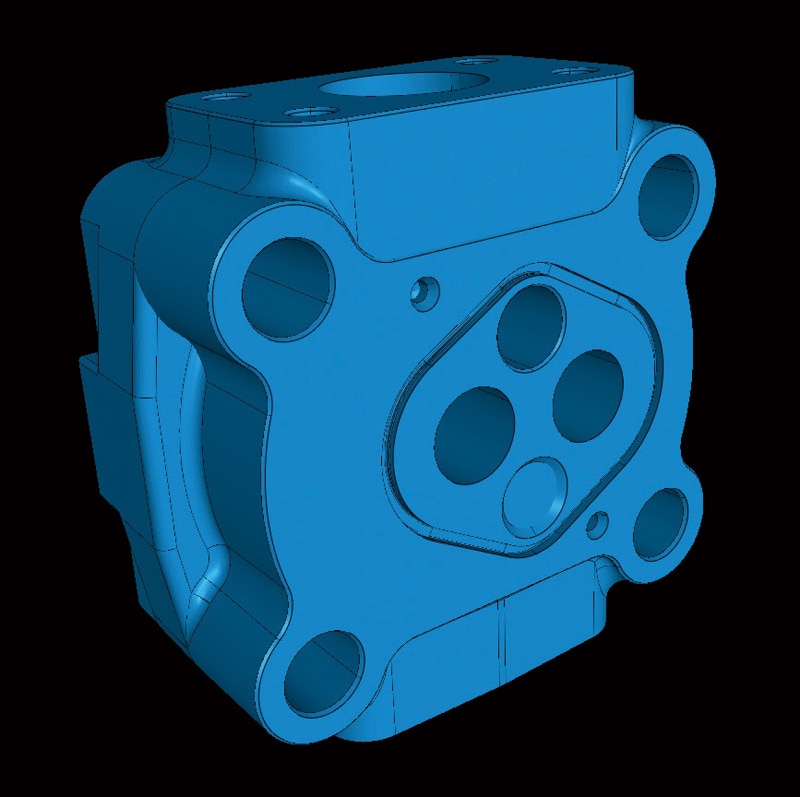
By scanning the die cast part before machining and then specifying the surface after machining (CAD data), the software can determine which voids are removed by machining, which remain internally, and which are exposed on the surface after machining.

Voids that are removed
Internal voids
Voids exposed on the surface

 
muestra
3D CAD
muestra
Void Determination Based on Specifying Defect Cross Section and SurfaceBlue line: CAD data analysis after machining
 

GFRP(Glass Fiber Reinforced Plastic)

muestra
Cross Sectional Image FOV = ø20 mm
muestra
Cross Sectional Image (enlarged view)
muestra
Cross Sectional Image (enlarged view)
 
muestra
VR Image
muestra
Defect Analysis
muestra
Defect Analysis Histogram
 
muestra
muestra
Fiber Orientation Analysis
muestra
Fiber orientation analysis can display a color-coded map of filler orientation. Needles can also be displayed based on the orientation.
 

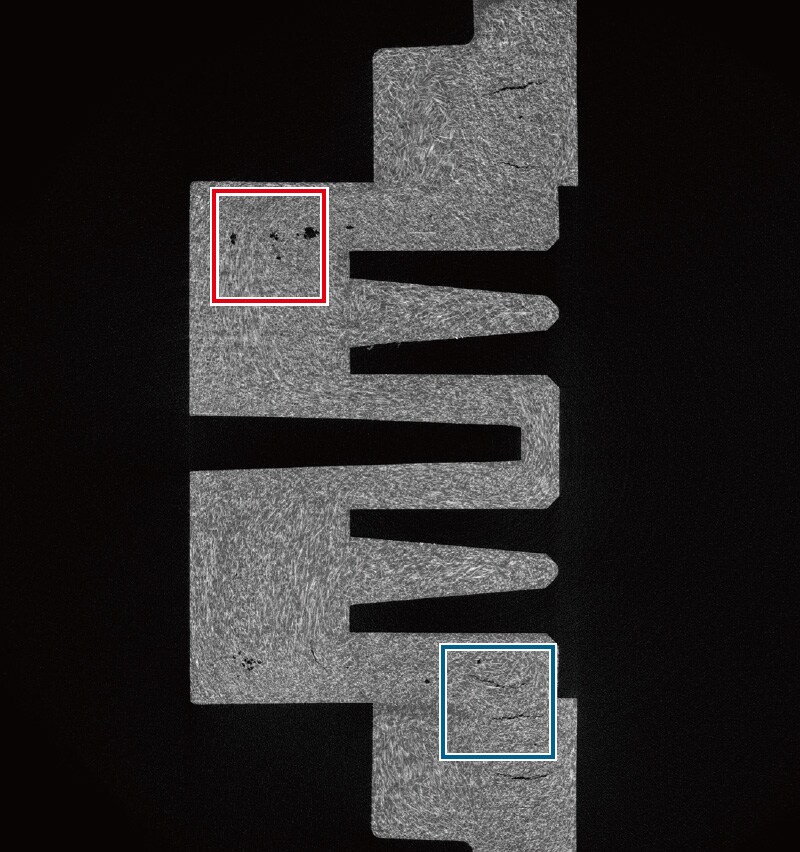
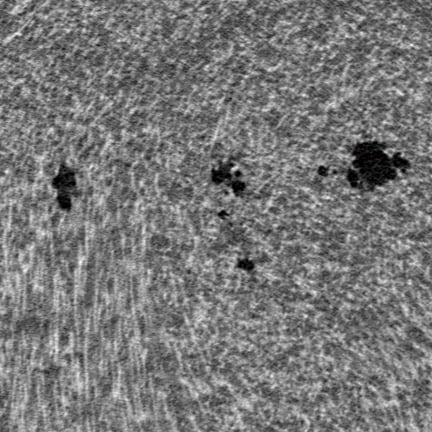
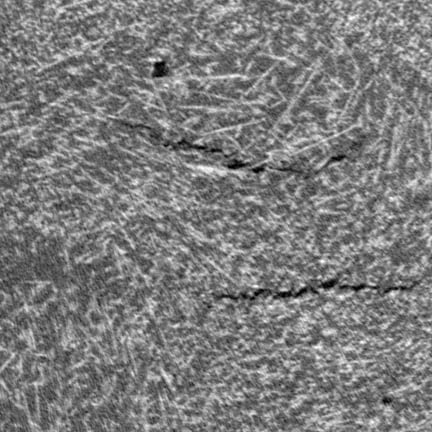
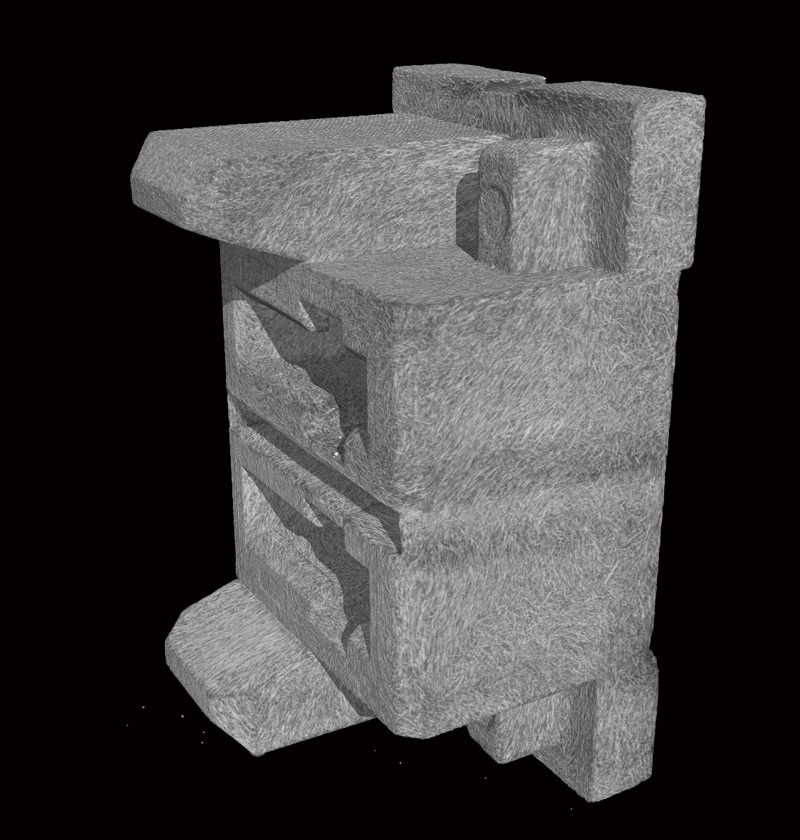
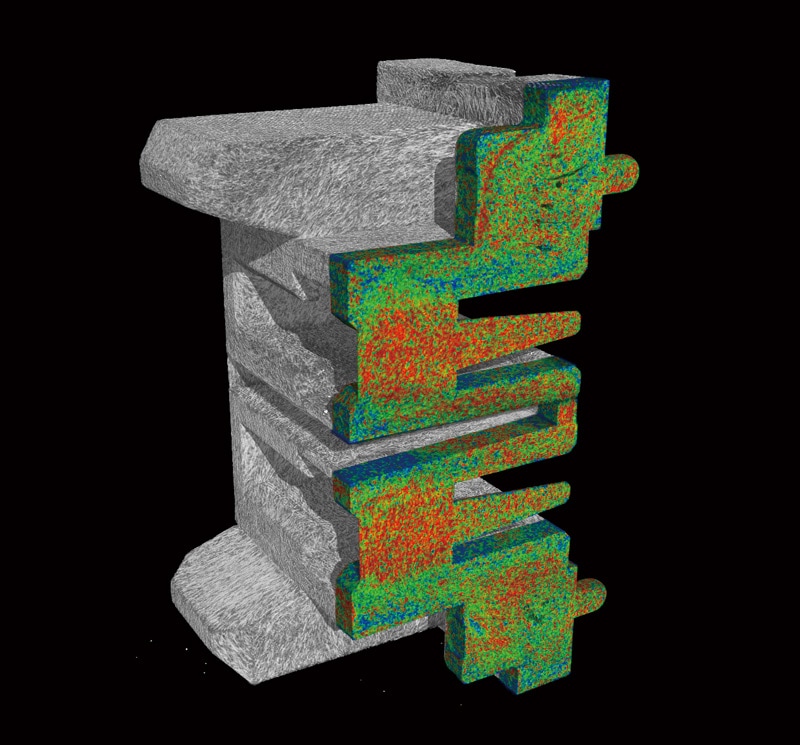
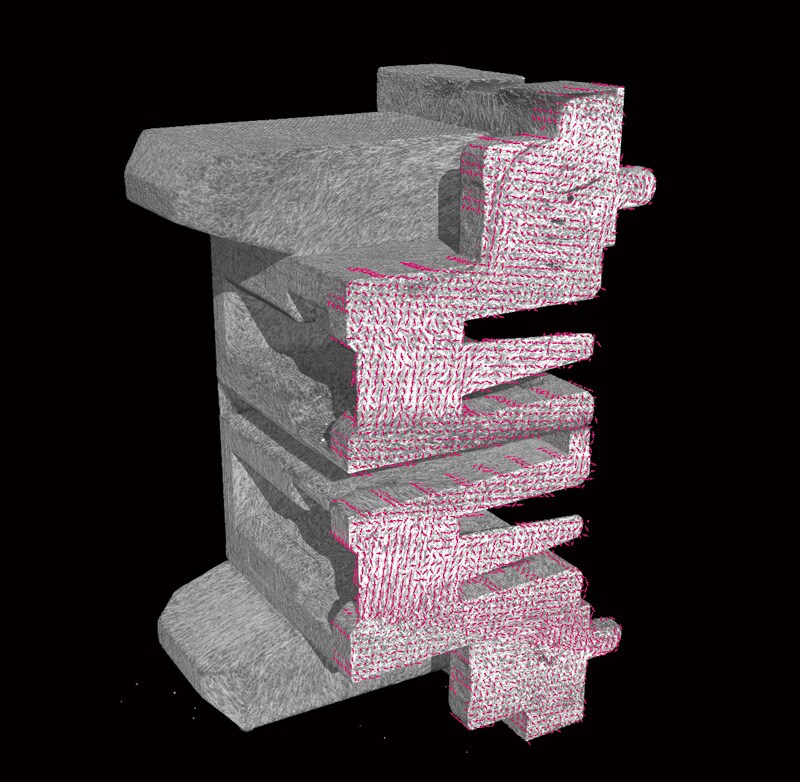
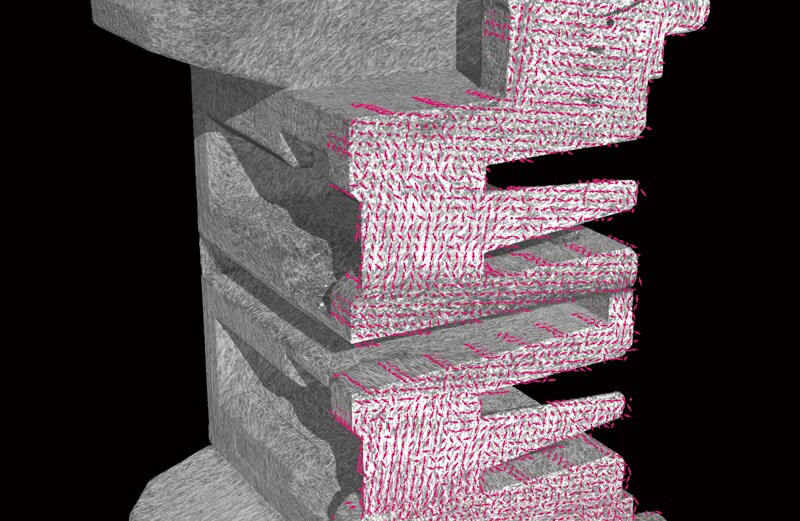
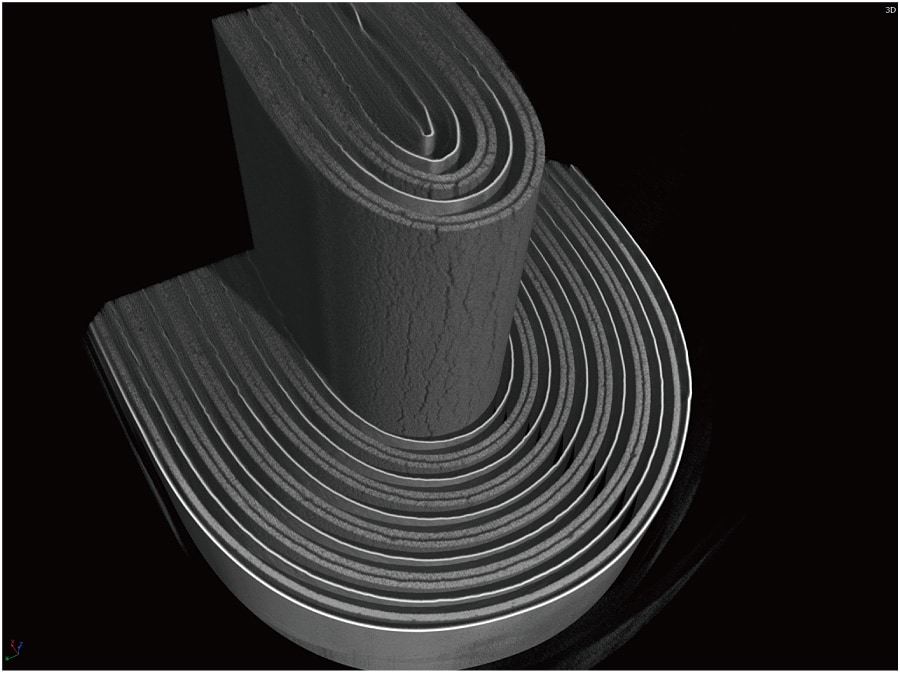
CFRTP (Continuous Fiber Reinforced Thermoplastic Laminate)

muestra
MPR Image FOV = ø3.9 mm
muestra
Oblique Image
muestra
Defect Analysis
 
muestra
VR Image
muestra
Fiber Orientation Analysis

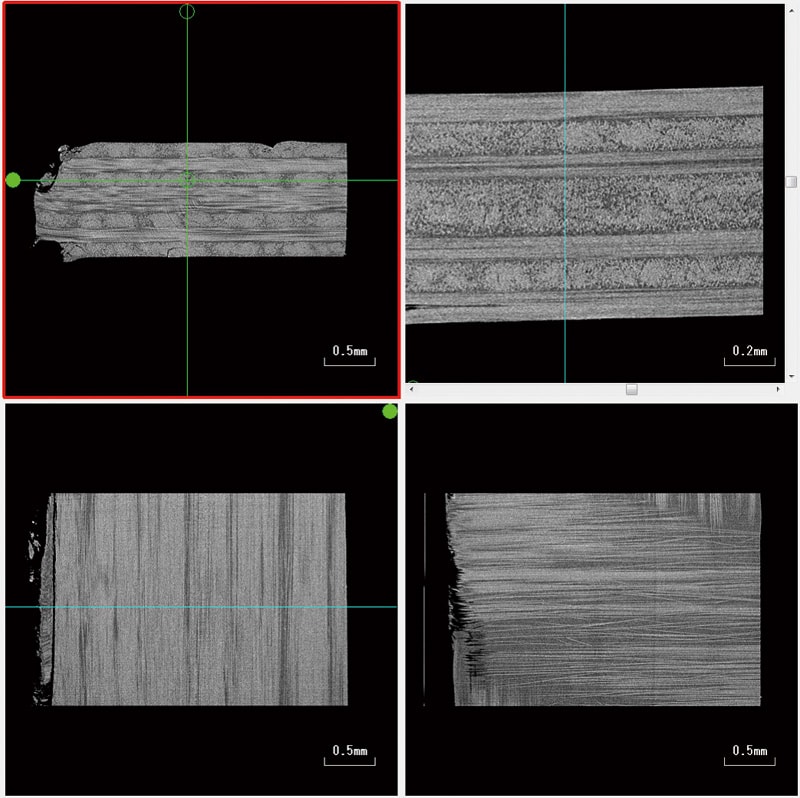
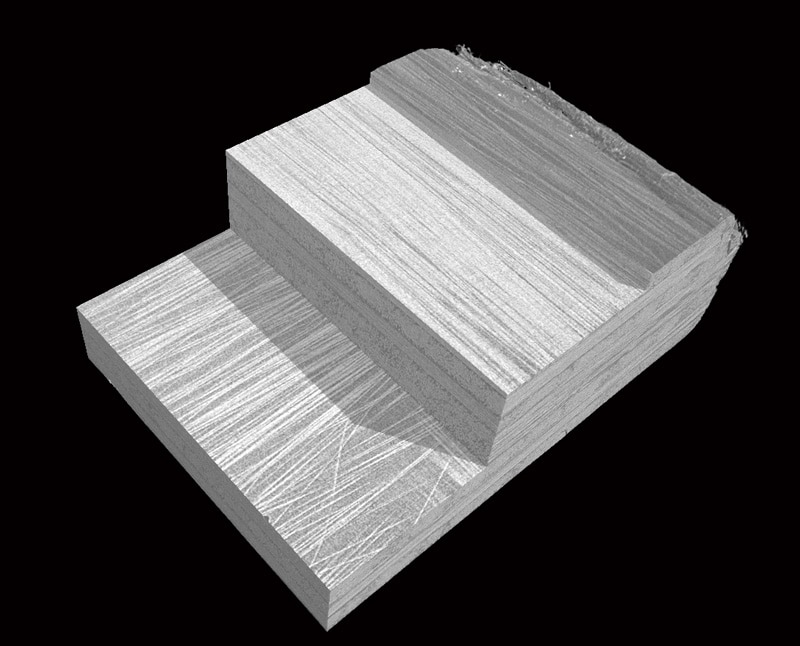
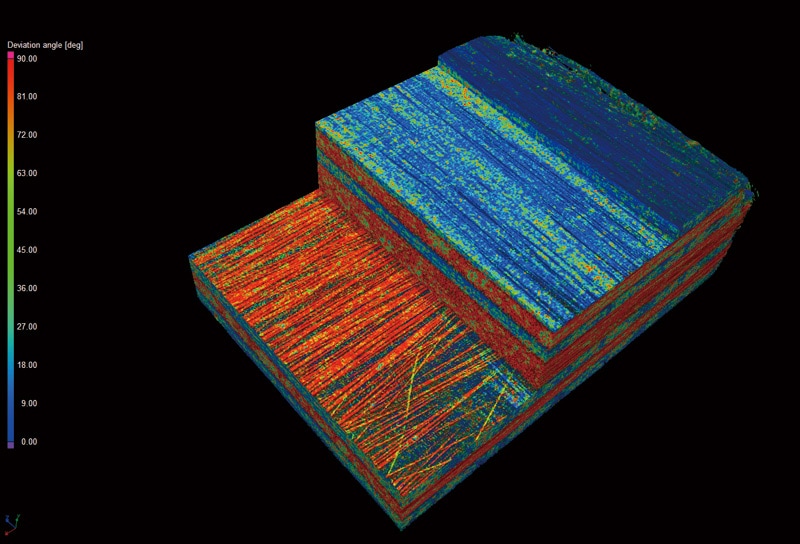
Provided by Ehime University
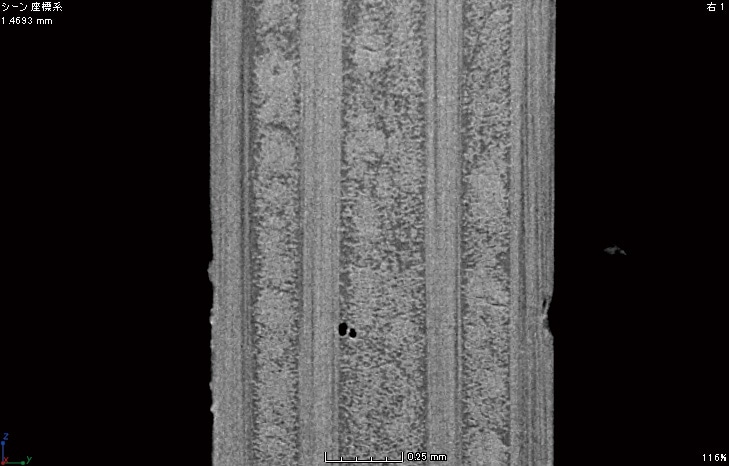
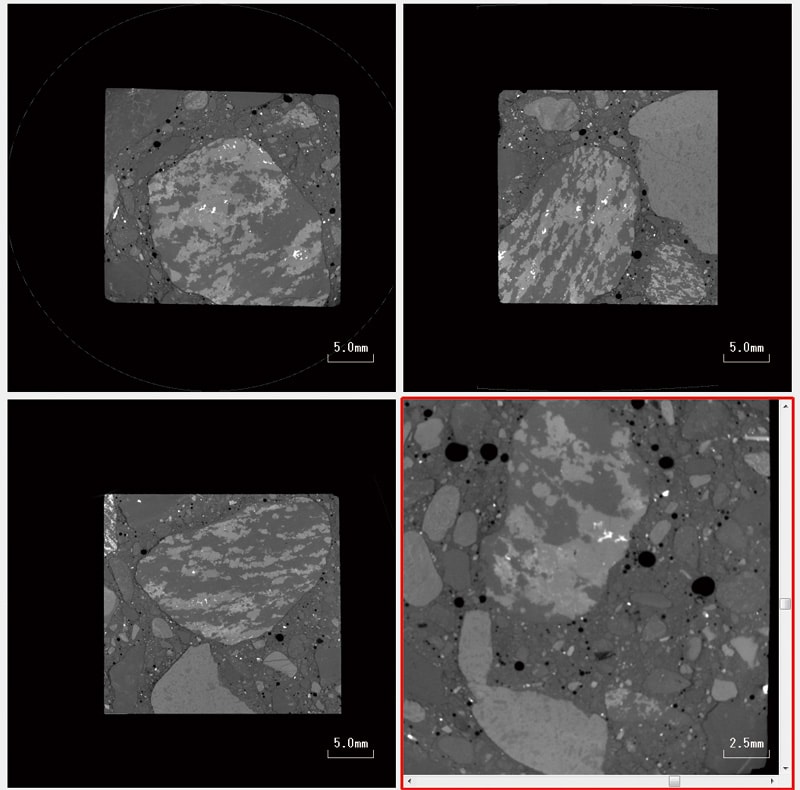
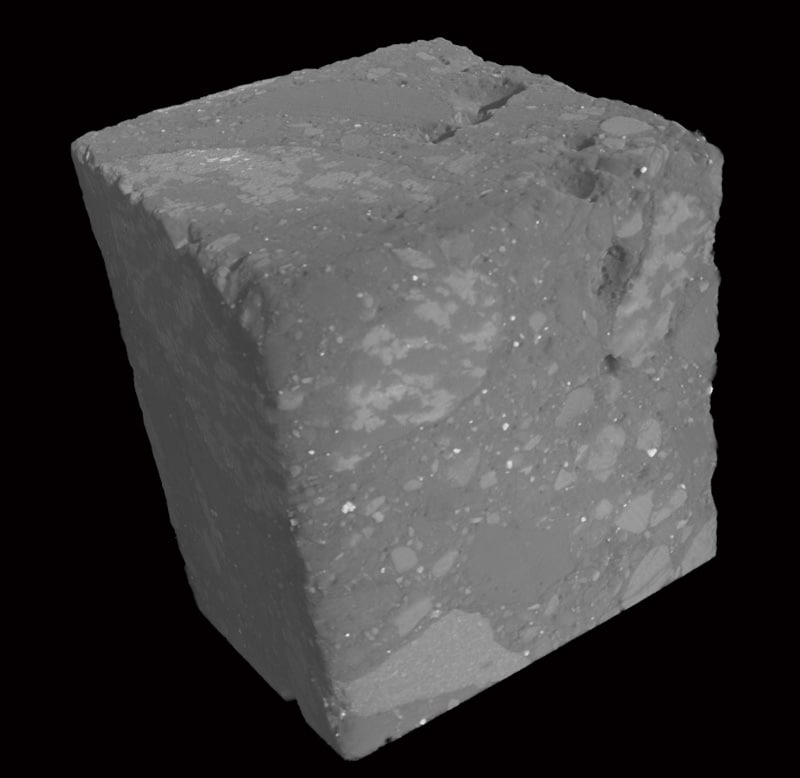
 

BGA (Ball Grid Array)

muestra
MPR Image FOV = ø5 mm
muestra
VR Image
 

Concrete

muestra
MPR Image FOV = ø42 mm
muestra
VR Image
muestra
Provided by Emeritus Professor Moriyoshi at Hokkaido University
 

Lithium-Ion Rechargeable Battery

muestra
Cross Sectional Image FOV = ø18.4 mm
muestra
Oblique Image
muestra
VR Image
 

Rectangular Lithium Polymer Battery (for Smartphones)

muestra
 

Circuit Board

muestra
MPR Image FOV = ø 4.4 mm
muestra
VR Image
 

Mouse fetus

muestra
MPR Image FOV = ø 13.7 mm
muestra
VR Image

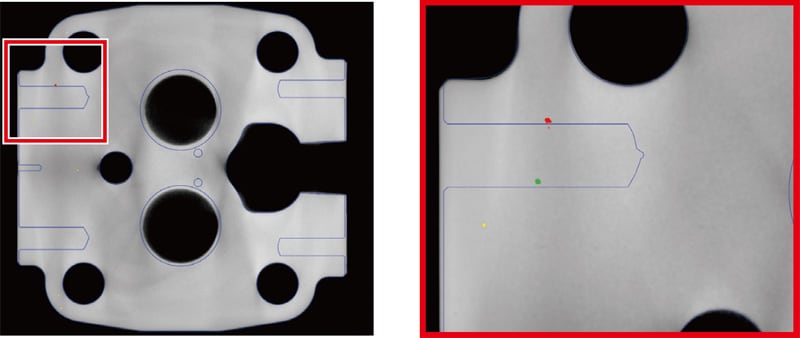
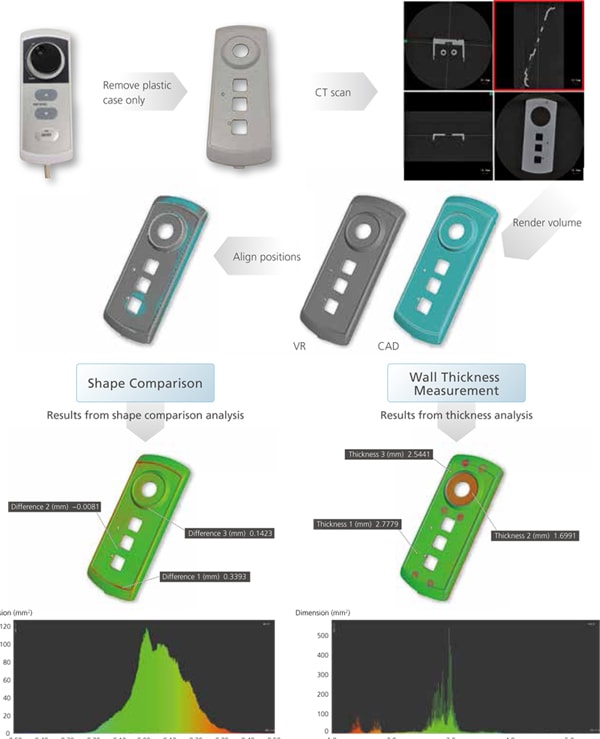
Analysis Using PointMaster Reverse Engineering Software

The software can align CT data with 3D-CAD data, calculate the distance between the boundary surface defined in the CT data and the corresponding 3D-CAD data, and display a color-coded map based on such differences.

For inquiries about the absorbed dose to samples such as semiconductors, please contact here.