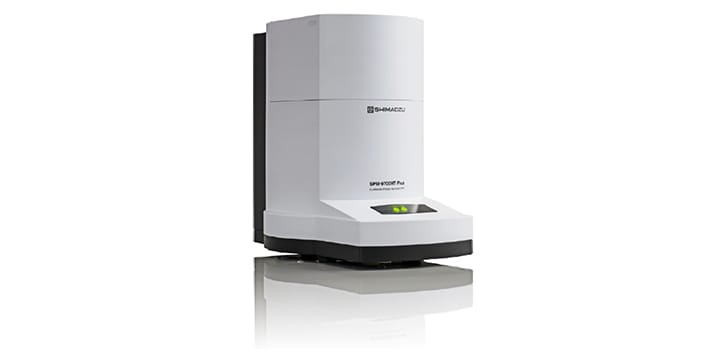
SPM-9700HT Plus


- Current distribution (1 pA to 10 mA) and resistance distribution (0.1 Ω to 10 TΩ) in electronic materials such as semiconductors and batteries can be detected over a wide range. - Carrier concentration distributions in semiconductor devices can be estimated from resistance distributions. - Distributions of active material and conductive additives, as well as electron conduction paths, in lithium-ion battery electrodes can be estimated from resistance distributions.
In semiconductor devices and liquid lithium-ion batteries (LIBs), the microscopic distribution of components affects device and battery characteristics, so understanding the resistance distribution inside the device at the nanoscale is important. Scanning spreading resistance microscopy (SSRM), a scanning probe microscopy (SPM) technique performed using an atomic force microscope (AFM), maps the resistance distribution in microscopic areas of a sample, making it effective for estimating the dopant concentration in semiconductor devices and visualizing electron conduction paths inside LIBs. This Application News introduces examples of evaluating an n-type Si sample and a liquid LIB positive electrode using SSRM.
October 28, 2026 GMT