Multi-omics Analysis Package
LC/MS, GC/MS Data Analysis Software
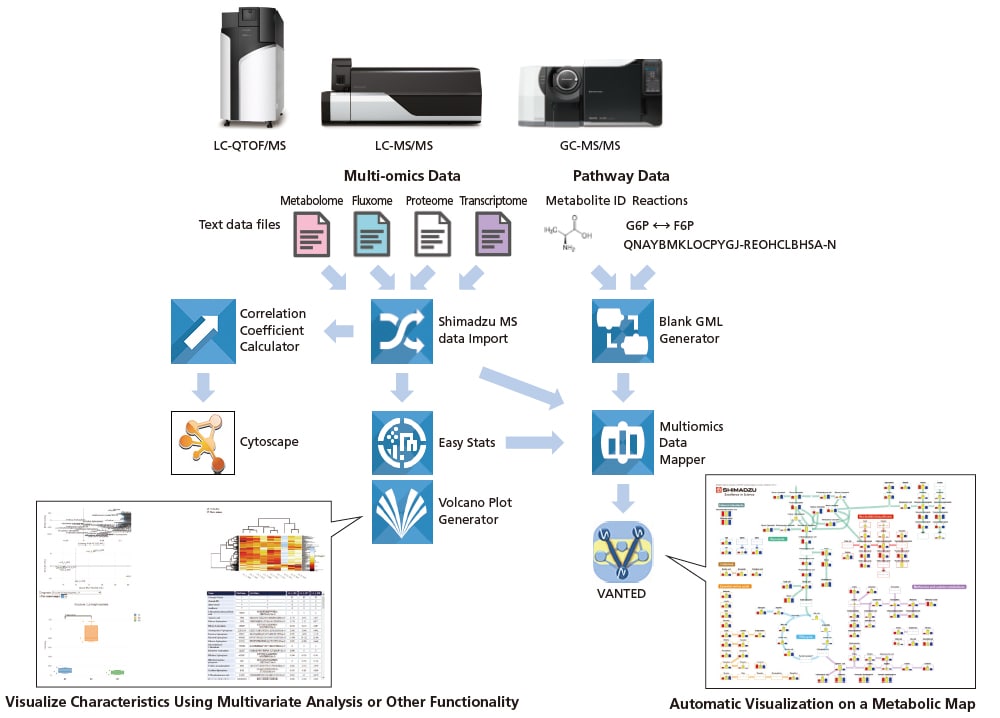
The Multi-omics Analysis Package is metabolic engineering software that can automatically generate metabolic maps and perform a variety of data analysis based on the vast amounts of mass spectrometry data generated in fields such as metabolomics, proteomics, and flux analysis. In conjunction with the various method packages and databases offered by Shimadzu for metabolomic analysis, the Multi-omics Analysis Package can help increase the efficiency of metabolomic data analysis work. The intuitive visualization of data provides powerful support for drug discovery, functionally-enhanced foods, bioengineering, and other life sciences research applications.
Visualize Changes in Compound Quantities on a Metabolic Map Using Simple Operations
The software dramatically decreases the amount of work required for graphing measurement data or displaying it on a metabolic map.
Identify Significant Compounds Using Simple Operations
It makes it easy to use volcano plots for comparing two groups, principal component analysis (PCA) for comparing multiple groups, hierarchical clustering analysis (HCA), and box plots. Linked PCA, HCA, and box plot results can be displayed in the same window to conveniently identify significant compounds. The metabolic map can be enlarged to confirm where identified compounds are located on the map and to support confirming and interpreting the data.
Includes Visualization Template Files Compatible with a Variety of Method Packages
The templates are designed to work in combination with various Shimadzu method packages. These packages contain sample pretreatment methods and analytical conditions for use as “ready-to-use methods,” which ensure the entire process, from mass spectrometry analysis to data analysis, can be performed with ease. In particular, these visualization templates (metabolic map) are compatible with method package for Primary Metabolites, Cell Culture Profiling, Lipid Mediators, Bile Acids and Smart Metabolites Database. The templates can be used as-is or customized using simple operations.
Features
Videos
-
Procedure for Outputting a Text File
-
Visualization of Measurement Results on a Metabolic Map
-
Visualization of Measurement Results on a Metabolic Map~Time-Series Data~
-
Visualization of Volcano Plots by Comparison of Two Groups of Data
-
Visualization of Compound Correlations
-
Multivariate Analysis and its Visualization on Metabolic Maps
News / Events
-
LabSolutions Insight Profiler, Non-Targeted Analysis Software for LC/QTOF Data has been released
LabSolutions Insight Profiler is a unified, end-to-end workflow for LC/QTOF data processing — with a "single-click" approach. Insight Profiler is purpose-built for non-targeted analysis in suspect screening, unknown identification, and metabolomics across complex sample sets.
-
Cell Culture Profiling for LCMS-2050
This package includes a preconfigured method covering vitamins, amino acids, and other culture media components and metabolites secreted by cells.
-
Shimadzu has released the LCMS-8065XE
The new LCMS-8065XE is a triple-quadrupole mass spectrometer with EVOLVED, EFFICIENT, and EXACT capabilities. These exceptional capabilities ensure high reliability and enhanced productivity, empowering the laboratory for the future.
-
Latest issue of Shimadzu Journal, featuring Environmental Analysis, has come out.
This issue showcases advanced technologies and research tackling the global challenges posed by PFAS. As part of Shimadzu’s ongoing commitment to sustainability and problem solving, we strive to reduce environmental impacts and build a better future.
-
New High Resolution Accurate Mass Library for Forensic Toxicology
Perform forensic toxicology screening for drugs of abuse, psychotropic drugs, pharmaceuticals, pesticides, and natural toxins using this high-resolution accurate mass database.
-
Shimadzu has released the Shim-vial™ H glass, S glass.
Shimadzu provides high-quality vials that thoroughly eliminate these risks by visually inspecting each vial, allowing them to be used with confidence.
Sustainability initiatives
-
3 Good health and well-being